data mining processing. computer, graphs, diagramsPortfolio indicators or Key Performance Indicators are paramount in having a global view of the organization and its project performance. In this article, we review the most important ones.

KPI 1: Internal demand in number of days / workers

 When your organization manages internal projects, whether it be change projects or new product development, the client and the project sponsor will from within the company. That is why, when poorly managed, internal project portfolios can become crazy races, causing disputes between the various promoters as they try to get ahead of each other in order to increment the team staff, acquire additional funding or the favour of the board of directors. 

Try ITM Platform and know the status of your project portfolio at all times 

Therefore, it is very important to be clear, at all times, about what the total internal demand of each area of ​​the organization is generating for its different projects. It is true that you can rely on what is the largest project or what are the criteria to incur costs, but while the first is a partial indicator, the second does not allow you to see the development of the planned workload. The internal client demand indicator is the perfect KPI for this purpose. Thanks to this, you will know how many days of work each department or functional area of ​​your company generates in the project teams. This information is not only valuable for the CIO and the CEO, but can also help you establish a maximum demand limit for days worked related to the organization (throughout time).

components/total budget

Of course, if there are transversal projects that involve several departments, it is essential to have a good system of project allocation, so that the information contained in the system is not distorted and the indicator is actually useful.

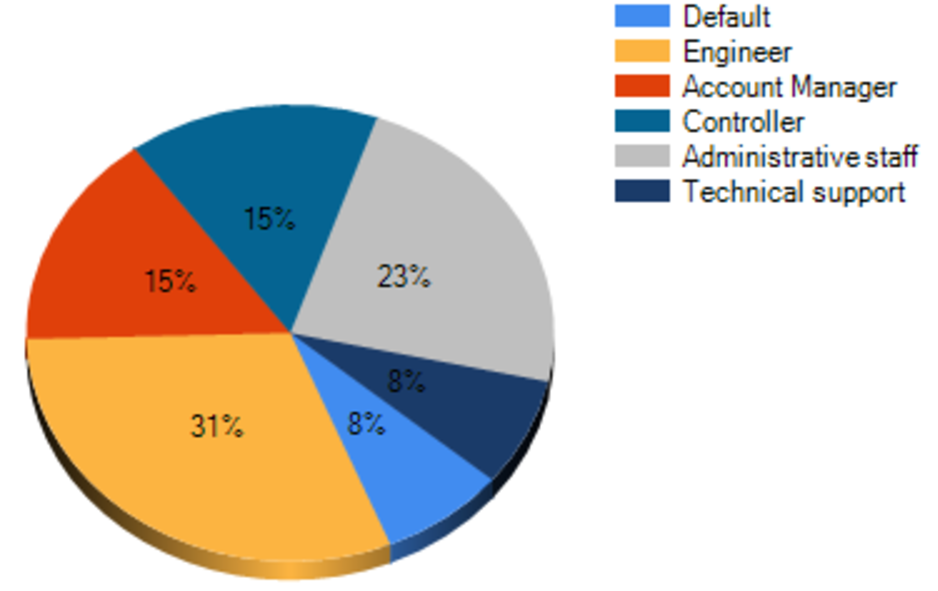
KPI 2: Employees by professional profile

If your organization relies on consultants for your projects, it is very possible that the available skills vary greatly over time. Today you could have four experts in programming JavaScript and none in four months. Hence, it is important to be clear at all times what the composition of your human resources by professional profiles are. The evolution of this indicator will facilitate the work of your PMO, the planning of resources as well as the identification of gaps or oversupply. In addition, graphics are very useful for the management team, as they easily communicate the structure of the personnel involved in projects.

the structure of the personnel involved in projects, diagrams, percentages

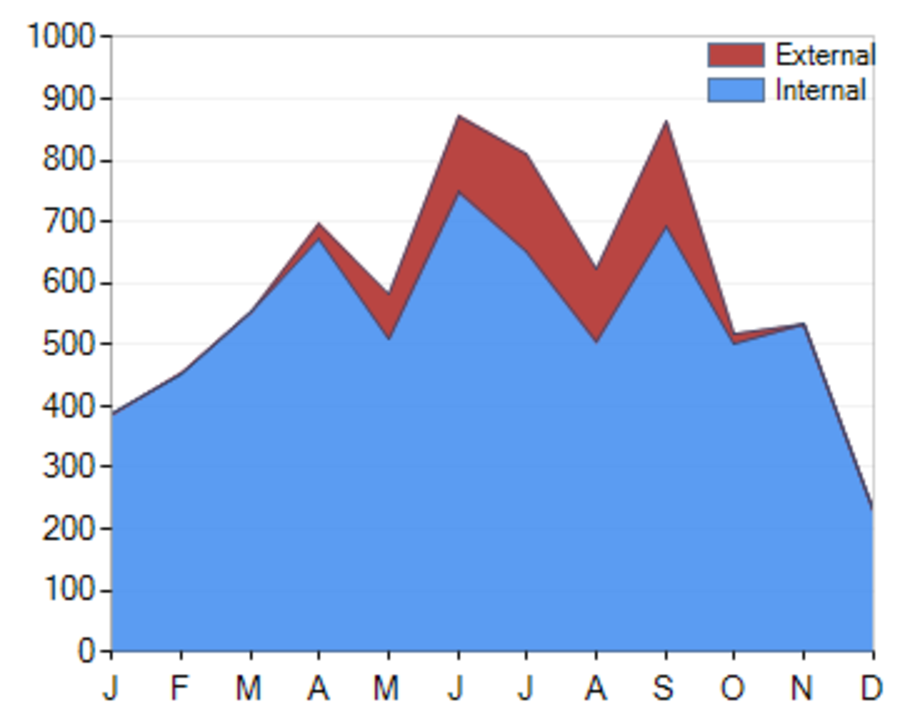
KPI 3: Estimating effort

The previous indicator would do little to manage the portfolio if we could not anticipate the future needs of certain profiles. For this, it is essential to have a view of the estimated efforts in the coming months. Each project manager takes into account where the greatest effort is concentrated in for the projects for which he is responsible for, but very few have the necessary information to know if the "hot seasons" of each project coincide. From such a chart, portfolio managers would know when there is a greater risk of scarcity of certain skills and can plan accordingly. In the given example, the busiest months are June, September, July and April, respectively.

external and internal estimated effort

KPI 4: Budget by objectives

budget by objetives, diagram, percenages

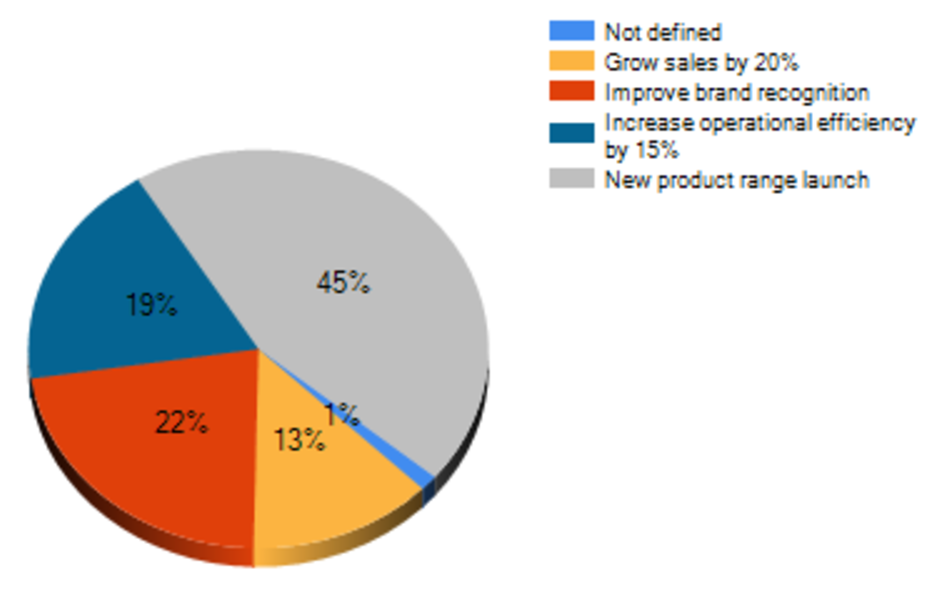
Within the economic indicators, one of the most interesting from the point of view of the portfolio is the one that indicates the aggregate investment that is being allocated to each one of the objectives of the organization. This indicator should serve as confirmation that the management of the project portfolio is following the strategic guidelines established by the highest management bodies. If a goal has the highest priority, it is logical that it is receiving the highest share of investment. Any contrary discrepancy must have sufficiently justified grounds. In the given example, if sales growth were more important to managers than increased operational efficiency, the portfolio should be revised to ensure that total investments in these areas correspond to the priorities. It is possible that the operational improvement currently has a very expensive project of change but of limited duration, after which completion the percentages would be re-adjusted.

KPI 5: Process budgeting

process budgeting, diagram, percentages
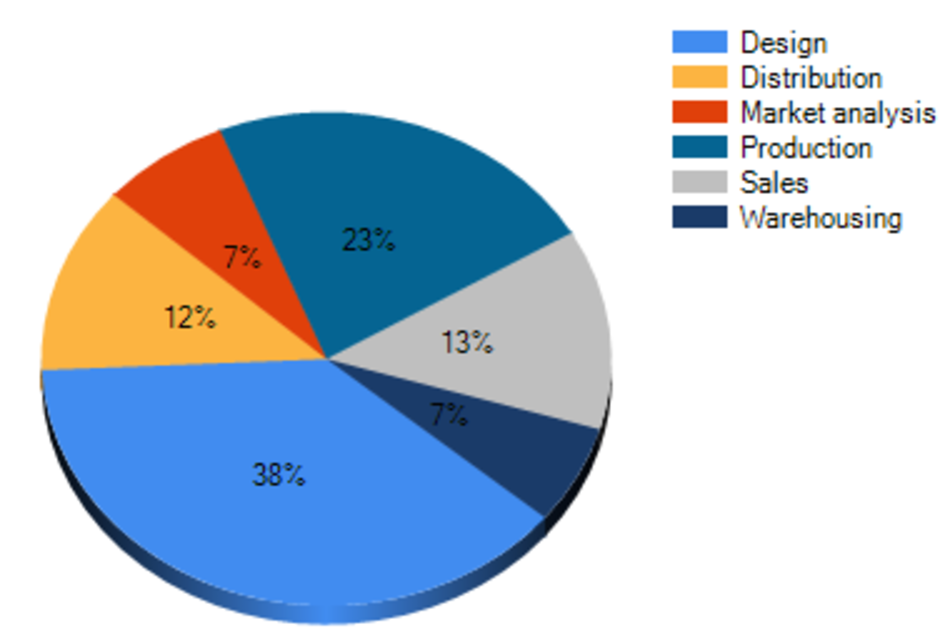
What business processes are absorbing more investment? In conjunction with the domestic demand indicator, this indicator leads to optimization, cost reduction and the elimination of redundancies and inefficiencies. Processes that are considered marginal and low value-added often consume resources for administrative and maintenance reasons that are difficult to reduce. However, it is crucial to know what the natural or average value of this indicator is and to ensure that it never rises above it. In the given image, assume that the average cost of storage for 'GlobalCorp360' is at 8%. If at any time it rises above 12% for no apparent reasons, this becomes alarming and yields more than enough evidence to submit the process to an audit.

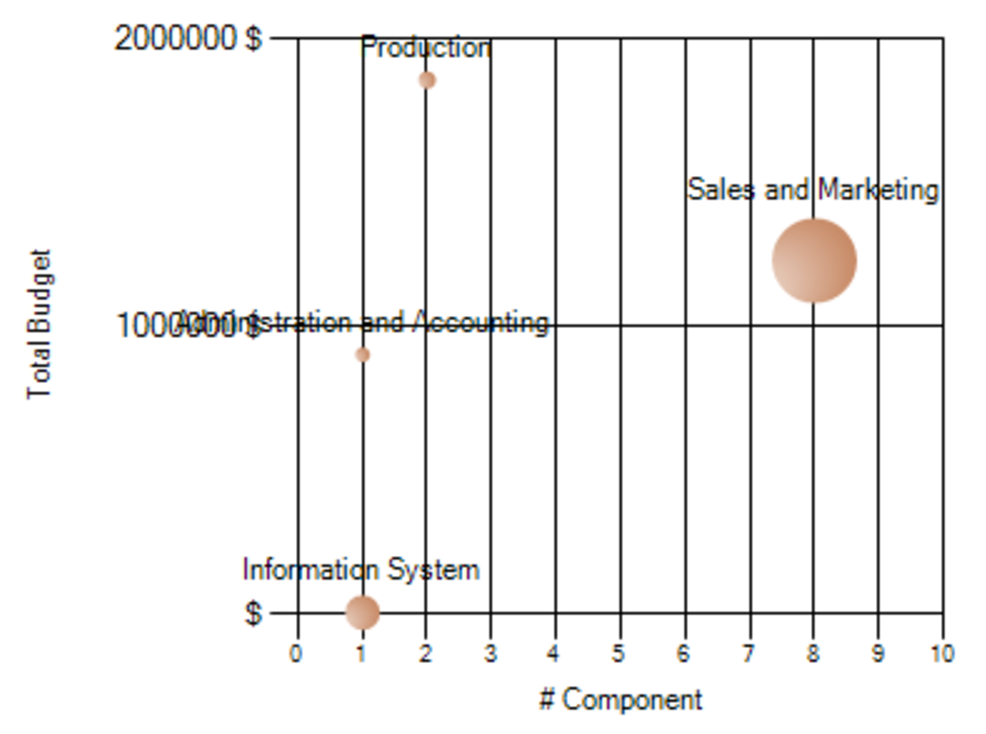
KPI 6 and 7: Budget by component and current cost per component

Budget by component and current cost per component
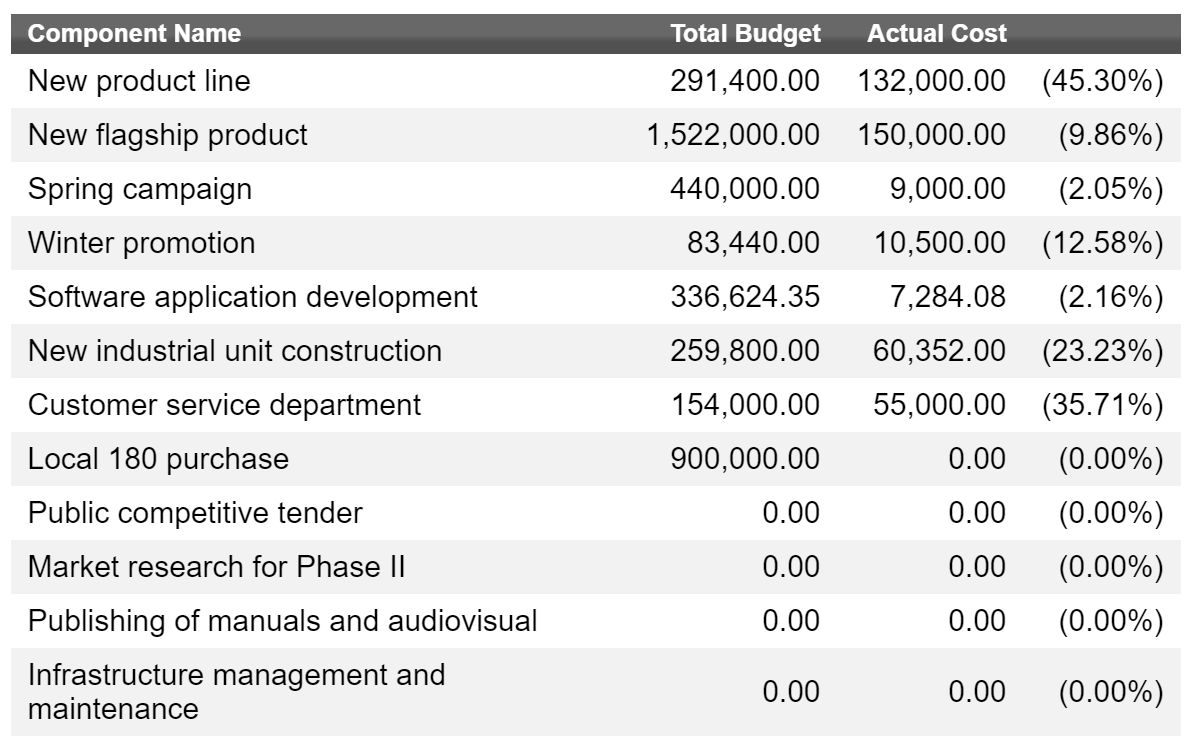
The simplest indicator, which shows the budgets for each of the projects involved, remains the most useful for the portfolio manager. As with the calendar for an event manager, the director of a portfolio should always have before him a written reference of the budget of each project. The person responsible for a portfolio must demand the highest precision of the budgets and the costs incurred by each project. For the same reason, it is essential to have a solution that, like ITM Platform, updates the information immediately each time a new invoice is registered, without having to wait for periodic reports.

Receive the latest blogs directly into your inbox


business man, parachute, crocodile, seaLet’s face it, even if you have the utmost confidence that your project will be a success, there is always the possibility something can go wrong. Wise project managers will identify the project risks in the early stages of the project to give themselves more time to develop a plan on how they can avoid them if they arise. However, risk management is an ongoing activity and can’t be done just once.

Here are a few key components of risk management:

A Contingency Plan

Essentially, this is a plan developed to help the company respond to a possible future situation that could occur but isn’t outlined in the original or “expected” plan. The project team will find solutions ahead of time in the case that the problem appears. A contingency plan is also often referred to as being “plan B”, one which can be put in place in only a moments notice.

For instance, suppose the completion of a product significantly depends on purchasing a component from a supplier. Although for whatever reason, the deal is unable to be made which can set the end date of the project way behind schedule. To prevent crisis from occurring, project managers will use contingency plans that will be implemented immediately to resolve the issue.

The Risk Assessment Matrix

This is a well known project management tool increasingly used in risk management. In a single page, it will organize all of your possible risks based on their likelihood of occurring and the severity of their consequences. You will need this in order to develop an effective risk mitigation plan and project strategies.

The risk management matrix can only be completed after you have filled out a risk assessment form. In this form you will have to uncover and list out all potential risks that may be a threat to your project or company. You will need to gather data about these possible risks, understand their consequences, determine the probability of them occurring and brainstorm possible prevention strategies.

The risk assessment matrix will then be able to provide the project management team with a quick and useful overview of the risks to help them prioritize which should be dealt with first.

The team will need to work together to decide which level of risk can be tolerated and which ones should just be “accepted” and left to be watched. Our new free tool for risk analysis allows you to register, quantify and share risks.  You can also save different sets of risks, such as those for a project, business, process or any other context in which you are working. You can share them collaboratively as well.

Risk assessment matrix

Each circle represents the estimation of a risk. Colors and sizes of circles depend on the exposure level of the risk. They are fully configurable, simply click on the “customize values and thresholds” tab.  

If you click on the “see matrix” button in each of the risks, you’ll be able to see all of the possible combinations for impact, probability and place of the product; i.e the numerical value of the level of risk exposure.

Risk matrix

Risk Mitigation Planning

This process involves creating possible options to help strengthen future opportunities and reduce threats to your project objectives. It will require project management team members to continuously track the current identified risks while searching for new ones. They will also need to evaluate how successful the risk management process is throughout the development of the project.

It is best if you refer back to the chart below when applying risk mitigation. The Risk Mitigation Handling Option you choose to use will once again depend on the probability of a risk occurring and the severity of its costs. There are several handling options that can be used:

Probality, Comsequence, risk matrix

Avoid: You can change your current project requirements to reduce the risk from occurring. However, don’t be surprised if this also impacts your schedule, funding, etc.

Control: Implement new actions to diminish the impact the risk will have.

Transfer: Reassign the projects responsibility or authority to another stakeholder willing to take on the risk

Watch: Constantly monitor the project and its environment for any changes that may impact or increase the risk.

Assume: You may choose to acknowledge that a particular risk exists and then willingly make the decision to accept it without trying to control it in any way.

In a nutshell, risk mitigation planning requires you to think about the probability of the risk occurring and materializing as well as the impact it will have on your objectives if it does.

Steps to Risk Management

Simply put, risk management is a 2 step process that starts with determining what risks exist and then handling those risks. Although, you should develop an action plan which includes all of the 5 steps mentioned in the PMBok:

Step 1: Initiating

This step is all about brainstorming. You will need to determine the project manager, the company culture and understand the business case. You must review and uncover possible risk sources by determining initial constraints, requirements, assumptions and agreements. If you have an strong project management tool, like  ITM Platform, you will be able to categorize and prioritize risks depending on if they have a high impact or high probability of occurrence.

Step 2: Planning

This stage involves developing a plan for each knowledge area. To do so, you must perform risk identification, qualitative and quantitative risk analysis and risk response planning. Once this is done you will need to finalize your management plans by developing a performance measurement baseline. By doing so, you will now have successfully developed responses to the risks you previously uncovered.

Step 3: Executing

From here on you will want to execute all of the work being done according to the PM plan you have created in the previous stage. Look to continuously improve by following the processes but also implementing approved changes. You must determine whether the processes are effective by evaluating individual or team performances and performing quality audits. Make sure you give strong feedback as well as recognition to employees when a job is well done. Following your management plans will reduce risk likelihood but will also prepare you in case something does arise.

Step 4: Monitoring & Controlling

With change can come brand new risks, but you will need change to occur if you want your business to grow. In this case, you must bring on change in a controlled way. Start off by measuring the performance of your team members as well as the project as a whole by comparing it to other metrics you have in your PM plan. Determine whether or not variances require corrective actions or change requests. You should request changes regardless and then update the PM plan accordingly.

Step 5: Closing

You must start off by assessing whether the work completed is done based on the requirements listed previously. Gain acceptance over the final product and then hand it off to be able to receive customer feedback. After this is all done you should record the lessons you have learned, all of the risks you may have encountered and the knowledge gained. All of this will help you out in the future.

Risk management isn’t an easy task and it’s natural to feel unsure on how to go about it. The best thing you can do is implement a PM tool that will help you with the process. ITM Platform provides their users with a new and innovative tool to help with calculating and managing project risks. Furthermore, their friendly and supportive staff has your back every step of the way so you’ll have no need to worry.

Visit http://www.itmplatform.com/en/ to find more information.

Top 5 most read blogs on ITM Platform:

The Monte Carlo Method in Project Management

Extra Extra Extra!

Three disastrous project management failures

The project in the face of adversity: what should a project manager do?

What is Virtual Stock Management or Periodical Online Management?


Receive the latest blogs directly into your inbox