
A dozen techniques to identify risks
Three months into a project, a key supplier announces that it is discontinuing a component your design depends on. Afterward, someone from purchasing mentions that the supplier had been hinting at it for a year. Nobody had asked them.
Many risk registers are written in a single meeting, by the project manager, from memory. They hold the risks everyone expected, such as a late delivery or a budget overrun, and miss the ones only someone outside the room could have named.
Risk identification means finding and describing the events that could affect your project’s objectives before they happen, so that each one can be assessed and given a response.
No formula produces a complete list. What exists instead is a set of techniques: IEC 31010:2019, the international standard on risk assessment techniques, describes more than forty. This article covers twelve that a project team can run without a risk specialist, grouped by where they look for risks.
Combine several, because each finds risks the others miss. The techniques structure the conversation; your team does the identifying.
The twelve techniques at a glance
| Technique | Best for | Effort | Who takes part |
|---|---|---|---|
| SWOT analysis | A first, broad scan | Low | Team and sponsor |
| Brainstorming | Many ideas quickly | Low | Whole team |
| SWIFT | Plans and processes | Medium | Team and facilitator |
| Scenario analysis | Long projects | Medium | Team and sponsor |
| Checklists | Familiar, repeated work | Low | Project manager |
| Incident analysis | Recurring problems | Medium | People involved |
| Direct observation | Early warning signs | Low | Whole team |
| Fault tree | One event you fear | High | Technical experts |
| Bow tie | Major risks and controls | Medium | Team and risk owner |
| Interviews | Depth from key people | Medium | One person at a time |
| Surveys | Reaching many people | Low | Wide group |
| Delphi | Expert judgment | High | Expert panel |
Workshops that draw risks out of the team
1. SWOT analysis
SWOT (strengths, weaknesses, opportunities and threats) is a general business tool rather than a risk technique in the strict sense. Almost everyone knows it, so it makes a good opening exercise.
Its value is breadth. Weaknesses inside the project often point to threats outside it, and the opportunities column reminds the team that some uncertain events are worth pursuing.
2. Brainstorming
Brainstorming is one of the most common ways to identify risks: a group calls out possible problems and a facilitator writes them where everyone can see. It comes in three main forms:
- Free brainstorming. People call out ideas as they occur and build on each other’s suggestions. It is fast, but the most confident voices tend to dominate.
- Structured brainstorming. The facilitator goes round the group so that each person contributes in turn, whatever their seniority, at some cost to spontaneity.
- Silent brainstorming. Each person writes ideas on sticky notes or a shared board, and the notes are then pooled and grouped. It suits teams with quieter members.
The session produces a list that someone has to type into the risk register afterward. If your team uses an AI assistant connected through the ITM Platform MCP server, the assistant can create those risks in the project with your own permissions. MCP server explains the setup and what an assistant can read and write.
3. SWIFT
The structured what-if technique (SWIFT) is a facilitated workshop. The facilitator takes the team through a plan or process step by step and keeps asking “What if…?”: what if the test environment is not ready, what if the data migration takes twice as long.
It often starts from a brainstorming session. Each risk that comes out is then examined with its likely causes, its consequences and the controls already in place, which also shows how risks depend on each other.
4. Scenario analysis
Scenario analysis describes a few plausible futures and traces what each would do to the project: a key partner withdraws, demand doubles, a regulation changes halfway through. Where SWIFT examines single events, a scenario combines several changes into one picture.
It suits long projects, where the context is more likely to shift. For each scenario, the team agrees on its effect and on what to prepare.
Learning from what has already happened
5. Checklists
A risk checklist lists the risks that came up on similar past projects, and the team reviews it item by item. Organizations usually build them from lessons learned, sometimes grouped by source: technical, commercial, organizational and external.
Checklists are quick and thorough for familiar, repeated work. They only contain what someone has seen before, so they miss what is new. Use one as a starting point and ask what is different this time.
6. Incident analysis
Some risks nobody identified will still turn up during the project. When one does, analyze why it happened and what it did to the project, and record both.
That record becomes the basis for spotting future risks and for updating your checklists. When the same kind of incident keeps coming back, look for a deeper cause.
7. Direct observation
Direct observation has no formal procedure, yet it often gives the earliest warning. The people doing the work usually notice first: a supplier that answers more slowly, a component that fails tests more often, a stakeholder who stops attending reviews. Make it easy and normal for them to say so, and treat those reports as candidate risks.
Across a portfolio, observation can include the data. PMPilot, the AI assistant built into ITM Platform, answers plain-language questions about project data, and one of its documented examples is “Which projects are in trouble but have no risk flags?”. The answer points to risks that probably exist but nobody has recorded. PMPilot data analysis describes the questions it handles.
Tracing the causes and consequences of one risk
8. Fault tree analysis
Fault tree analysis starts from one undesired event, placed at the top of the diagram, and works downward through its causes in the shape of an inverted tree. Each level asks what could make the level above it happen.
Deeper levels reach the causes of causes. A late go-live may trace back to a late integration, and that to an interface specification nobody owns. Each branch is a risk in its own right, and the root causes are the ones worth acting on.
9. Bow tie analysis
A bow tie analysis puts one risk at the center of the diagram. The causes that could trigger it fan out to the left, much like a fault tree, and its possible consequences fan out to the right. Between them sit the controls: preventive controls on the cause side, which stop the risk from occurring, and mitigating controls on the consequence side, which limit the damage if it does.
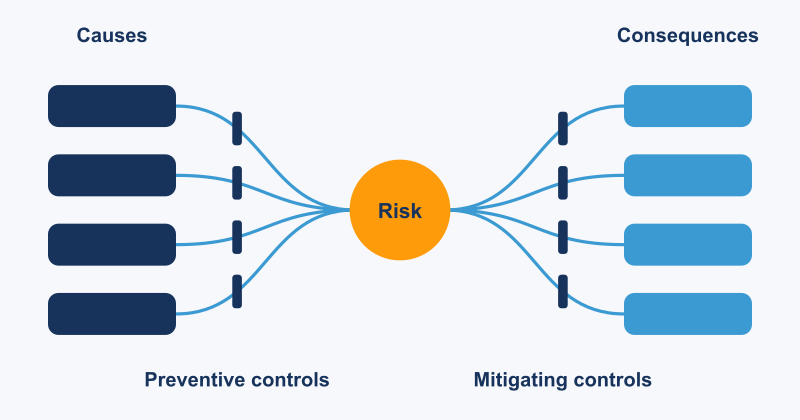
The diagram makes gaps visible, such as a cause with no preventive control. A practical sequence is to brainstorm the risks first and then draw a bow tie for each major one.
Consulting people individually
10. Structured interviews
In a structured interview, you ask people from different roles and levels the same prepared questions, with room to follow up. Speaking alone, people raise concerns they would keep to themselves in a group, and you can explore an answer that opens an unexpected thread.
11. Surveys
A survey takes the same idea in writing to many more people. It relies mostly on closed questions, so the answers are easy to compare across a large group, at the cost of the depth an interview gives. Use one when the people who might know about risks are many or spread out, and follow up in person on specific answers.
12. Delphi technique
The Delphi technique gathers expert judgment while keeping the experts apart. Each expert answers a questionnaire independently and anonymously. A facilitator summarizes the answers and sends the summary back, and the experts revise their views over several rounds until their positions converge.
Anonymity keeps the most senior or persuasive voice from steering the result. The cost is time, since several rounds can take weeks, so Delphi suits high-stakes questions.
Once you have the list
Identification produces a list of candidate risks, each of which then needs an assessment and a response. The client’s risk appetite decides how far that goes: a client who accepts some schedule uncertainty for a lower price will want fewer risks treated than one with a fixed launch date.
In ITM Platform, each identified risk gets its own record with a classification, a probability and an impact, which set its level on a configurable risk matrix. The record also holds a risk manager, a mitigation plan, a contingency plan and the tasks the risk would affect, and the risk can be escalated to an issue if it materializes. Risk and issue management walks through each field.
To see what the identified risks could do together, Monte Carlo simulation gives each risk and uncertain estimate a probability distribution and runs thousands of iterations, showing the spread of possible finish dates or costs. It finds no new risks, but it shows which of the ones you found weigh most on the end date or the budget.
Next steps
- Try ITM Platform and log the risks from your next identification session, each with its probability, impact and response plans.
- 6 steps to control risk covers what follows identification, from analysis to response planning and monitoring.
- See how AI agents connect to ITM Platform through MCP and work with projects, tasks and risks under your permissions.
Try ITM Platform free for 14 days
Start managing your projects, resources, and portfolios today.