How to estimate the duration of a task?
 Calculating the time neededto complete a project is a fundamental part of the planning process. Given that a project consists of multiple tasks, planning the schedule for a project as a whole is directly related to estimating the time needed to complete each one of the tasks.
Estimate the duration of your tasks within ITM Platform
Who should estimate the duration of a task?
This should be done by people who are used to completing tasks of a similar nature to the one being estimated. They will understand the complexity of the task and therefore the time needed to complete it. Similarly, when estimating the necessary budget or human resources, an opinion from an expert in the field might provide increased certainty and precision when planning the task. Nonetheless, any study should be supported by the greatest possible mathematical certainty.
How is the duration of a task estimated?
There are different methods that can be used depending on the associated risks and the intrinsic variability of the task.
It is a good idea to properly differentiate these two concepts. The risks should be included in the risk management process, and not considered when estimating the duration of the task nor included in the schedule. We should focus ourselves on time estimates at this point, which consider the variability factors inherent to the task and cannot be avoided, therefore requiring inclusion in the schedule. As is the case for any estimation, there is a core or average value and a confidence margin or interval, which will consist of a certainty percentage.
There are various estimation methods to choose from:
Estimation by analogy
This consists of estimating the duration of a task based on the historical data available. To do so, it will be necessary to gather information on projects similar to that which we wish to estimate and that have been previously completed by our company or others. A series of descriptive statistics can be obtained by knowing their completion times, such as the average completion time or the standard deviation from this parameter. Assuming that the duration of these projects follows a normal or Gaussian distribution, we can establish confidence intervals. Hence:
- The average +/- a standard deviation will provide a confidence interval of 68%.
- The average +/- twice the standard deviation will provide a confidence interval of 95%.
- The average +/- three times the standard deviation will provide a probability of 99%.
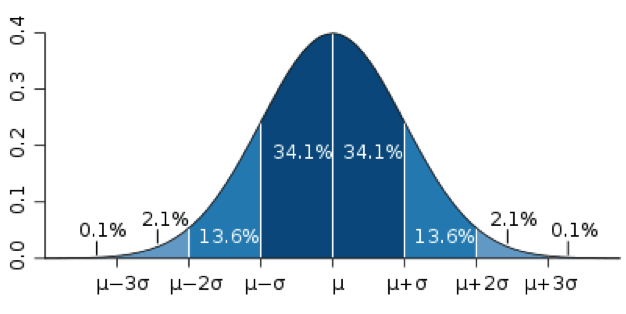
Gathering information on more projects will enable a more precise estimation of both the average and the standard deviation. At the same time, as can be seen, obtaining confidence intervals with a high accuracy percentage will mean that the estimated parameter will have a greater variability. By observing the Gaussian bell curve, it can be seen that making small changes to the typical deviations in the central values has a greater effect on the accuracy percentage for the estimate. However, at each end of the curve, larger changes must be made to the typical deviations to have even a slight effect on the degree of accuracy for the estimate.
Hence, for the majority of projects, studies are performed with a confidence interval of 95%; in other words, the average +/- twice the standard deviation. It is the agreed value for which the greatest degree of confidence can be obtained with the least variability in the estimated parameter.
Although a normal distribution will be obtained from the majority of studies (and the natural variables), the information gathered on previous projects will sometimes show a duration for the tasks that will better suited to lognormal distribution.
In these cases, the distribution curve is characterized by showing Gaussian behavior for the low values while showing logarithmic behavior for higher values. This means there are work groups that show abnormally high completion times. In these cases, there is no sense in calculating average values or typical deviations that include all the projects. The projects that show abnormally high completion times should be excluded. Those projects that “do not follow the norm” should also be studied, but in a different way. We should focus ourselves on finding external factors that affected their completion, about which we should also be aware.
Another possibility is that the scope of these projects was much greater than the other projects we are studying. If all the projects analyzed have a local scope and one of them has an international scope, it is likely that the latter required a much greater completion time. It would be more appropriate to perform a parametric approximation for such cases.
Parametric estimation:
This estimation technique is very similar to estimation by analogy but, in this case, there are no previous projects with a scope similar to that which we wish to undertake. The solution is to use correction factors that consider the magnitude of the project. Linear regression is the mathematical technique adopted to do this.
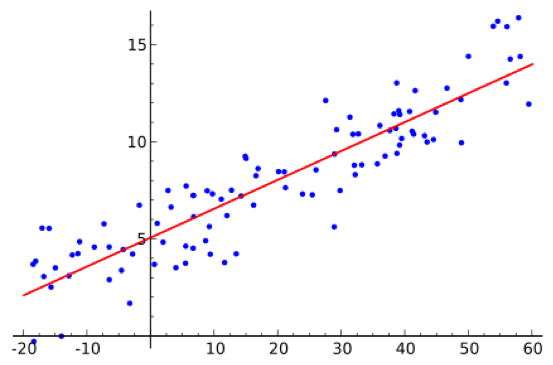
For example, if a project was undertaken at a national scale in countries with a small population and a large population without there having been any countries with an average population (the scope of the project we wish to undertake), one estimate should be made for the projects completed in small countries and another for those completed in large countries. Subsequently, a correction factor should be calculated based on the number of inhabitants. Hence, a process of interpolation will enable calculation of the time needed to complete a project in an intermediate-sized country.
The learning curve is another factor that should be taken into consideration. If a project needs to be completed repeatedly, it is obvious that it will be completed faster the more times it is completed. With this in mind, if all the data we extract are taken from experienced work groups, the estimation we obtain will not be realistic. It will be necessary to include correction factors that consider the number of repetitions and the learning curve.
Estimation by expert criteria:
This is the least recommended method but is sometimes the only one available (for example when there are no historical data or great disparity among them). It should also be taken into consideration that, although the other techniques explained above are mathematical, human intervention is still required to decide on the previous projects to be included in the study and the mathematical model to be applied. Hence, any type of study conducted by experts will imply a certain guarantee.
One way to improve this estimation is to use various experts independently. An average can be taken from the results proposed by each expert and a more overall and less biased view can thus be obtained from the particular criteria of each one. Another way to improve the estimate produced from this method is that known as three-point estimation. In these cases, experts are asked to produce an average estimate, a pessimistic estimate and an optimistic estimate. An average result is subsequently taken from these three estimates.
As is the case with any system, this one also has its faults. The pessimistic and optimistic estimates might consider external risks, which should not be included in the task duration estimate. It will therefore be down to the project manager to clarify or reach decisions on these points and enable a more precise estimation to be generated. In any case, as explained above, these latter methods are fundamentally based on human criteria and therefore more subject to error than other methods based on mathematical analysis.
Try ITM Platform free for 14 days
Start managing your projects, resources, and portfolios today.