Project Indicators: The Difference Between Estimated and Actual Percentages

You are halfway through a software project, and the Gantt chart shows 50% expected progress. But the team has only completed 30% of the work. Where did those 20 points go, and what do they mean for the deadline?
This is the kind of question that traditional “on time, on budget” reporting cannot answer on its own. While time and cost remain fundamental, they only tell you whether the project finished well. They say nothing about what happened during execution or where things started to drift.
Beyond on time and on budget
The most familiar project indicators fall under what practitioners call OTOB: On Time and On Budget. A project that hits its deadline and stays within the approved cost is considered successful by this measure.
Key Performance Indicators (KPIs) are metrics placed in context, typically as percentages, ratios, or trends, so they reveal how performance evolves over time rather than capturing a single data point.
But OTOB has a limitation: it is a retrospective measure. You only know the result after the project ends. To steer the project while it is still running, you need indicators that track progression in real time.
That is where the comparison between estimated and actual progress becomes valuable.
Estimated vs. actual: how progress diverges
Most project management tools calculate an expected progress based on the project schedule. If a project runs for 20 working days and 10 have passed, the expected progress is roughly 50%. The actual progress reflects the real percentage of work completed, as reported by task managers.
The gap between these two numbers is the deviation, and tracking how that deviation changes over time is far more informative than looking at either number alone.
Tools like ITM Platform calculate expected progress automatically using either duration-based or effort-based weighting. Duration-based weighting assumes work is distributed evenly across the schedule, while effort-based weighting accounts for variations in workload intensity. Choosing the right method for your project type ensures that the expected progress line reflects realistic assumptions rather than a simple calendar division.
Here is a practical example. The graph below shows a software development project where expected and actual progress diverge significantly:
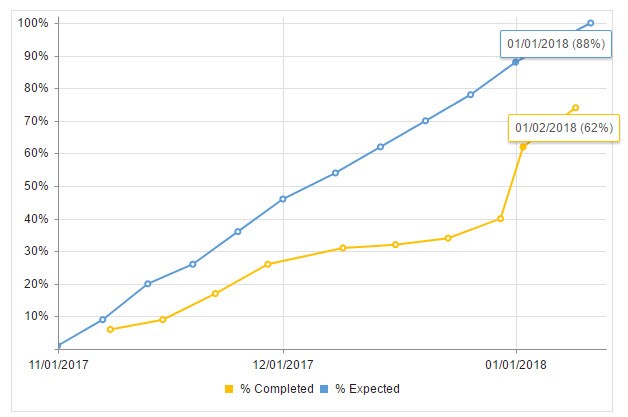
By January 1, 2018, the deviation between expected and actual progress reached 26%, though the gap was even wider in mid-December at 30%.
The real KPI: how the deviation changes
The raw difference between estimated and actual is useful, but the variation of that difference over time is the more powerful indicator. It reveals inflection points, periods of acceleration, and moments when the project started falling behind faster.
Consider the following data from the project above:
| Checkpoint | 1 | 2 | 3 | 4 | 5 | 6 | 7 | 8 | 9 | 10 |
|---|---|---|---|---|---|---|---|---|---|---|
| Estimated | 9% | 20% | 26% | 46% | 54% | 62% | 70% | 78% | 88% | 100% |
| Actual | 6% | 9% | 17% | 26% | 31% | 32% | 34% | 40% | 62% | 74% |
| Difference | 3 | 11 | 9 | 20 | 23 | 30 | 36 | 38 | 26 | 26 |
| Change in difference | +3 | +8 | -2 | +11 | +3 | +7 | +6 | +2 | -12 | 0 |
The most critical insight here is the inflection at checkpoint 4, where the difference jumped by 11 points and stayed above 20 for the rest of the project. That single data point signals the moment when something went fundamentally wrong, and it would have been the ideal time to intervene.
Between checkpoints 8 and 9, the team recovered 12 points. Was that a heroic final push, or did an external blocker get resolved? The indicator alone cannot tell you, but it tells you exactly where to look.
Diagnosing root causes
Once you identify when the deviation spiked, you can investigate why:
- Unrealistic estimates: If the original time estimates were too optimistic, examine the actual effort required to complete those tasks. Duration-based weighting may hide the problem if tasks had varying team sizes; switching to effort-based calculation can reveal a more accurate picture.
- Avoidable delays: If unforeseen obstacles caused the deviation, document them as risks for future projects. Building contingency and mitigation plans around these scenarios prevents the same pattern from repeating.
- External dependencies: A critical path blocked by an external factor can create a large, sustained gap that resolves suddenly when the blocker is removed. This looks very different from a gradual drift caused by an underperforming team.
A project management tool with built-in progress tracking curves helps here. When you can overlay the baseline plan against current progress and see both the expected and actual lines on the same chart, the story becomes visual and immediate. Customizable dashboards let you surface these comparisons at the portfolio level, so managers can spot troubled projects without opening each one individually.
Why one indicator is never enough
A single KPI, no matter how well constructed, can tell contradictory stories depending on context. The enormous recovery between checkpoints 8 and 9 could mean:
- An external blocker was finally resolved, releasing a backlog of completed work
- The team made an unsustainable effort to save the project before the deadline
- Scope was quietly reduced to bring the numbers closer together
That is why progress deviation should always be used alongside other indicators such as cost performance metrics, resource utilization rates, and qualitative input from team conversations. The best project status reports combine quantitative KPIs with narrative context from the people doing the work.
Turning indicators into action
Tracking the gap between estimated and actual progress is only valuable if it leads to decisions. Here are practical ways to use this KPI:
- Set thresholds: Define acceptable deviation ranges (for example, under 10 points is green, 10 to 20 is yellow, above 20 is red) and review projects that cross into yellow territory
- Review at regular intervals: Do not wait until the end of the project to compare estimated and actual. Weekly or biweekly reviews catch drift early
- Combine with progress reports: Pair the quantitative deviation with a brief narrative from the project manager explaining what is driving the numbers
- Use baselines: Comparing against a frozen baseline rather than a continuously updated plan prevents the “moving goalposts” problem where re-planning masks the original deviation
Next steps
- Learn how ITM Platform tracks estimated vs. actual progress across your project portfolio
- Explore configurable dashboards and real-time progress tracking: start a free trial
Try ITM Platform free for 14 days
Start managing your projects, resources, and portfolios today.