Qualitative risk analysis: an example within the videogames sector
Qualitative and quantitative risk analysis are two very different processes. In this article we explain qualitative evaluation with an example taken from the video game industry.
In general, qualitative analysis seeks to identify risks by using scales that summarize visually and intuitively the relative dimensions of each risk, allowing to prioritize: providing a visual representation that combines the most basic factors, such as the impact that the risk would have on a project and the likelihood of it occurring.
In spite of its name, qualitative evaluation implies a numerical estimate of these two variables along previously defined scales using a quick and subjective approach. It’s something like when doctors ask: From one to ten, how much does it hurt?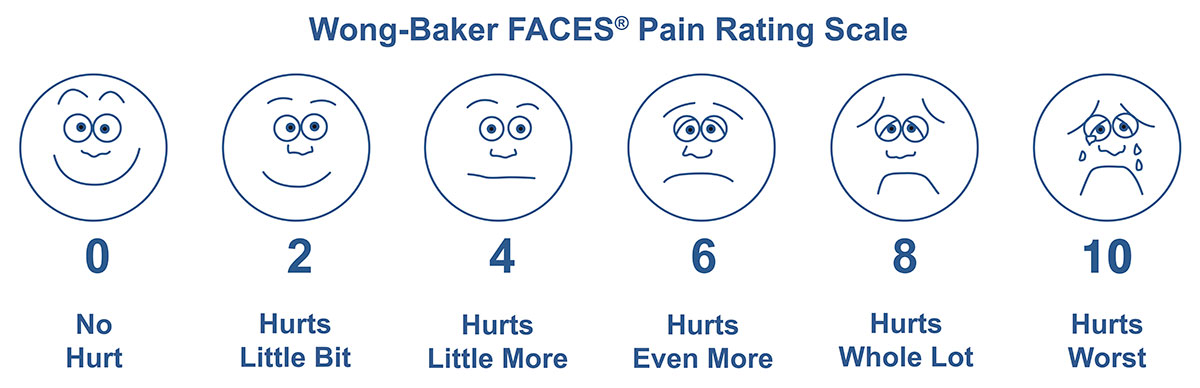
Similarly to the intuitive scale of Wong-Baker’s expressions, qualitative assessments of risk have visual translations in a geometric representation that allows a systematic comparison in risk assessment matrices.
In the example that follows, we have used our online risk assessment matrix to estimate the comparative weight of the following risks for a team of developers in a video game studio:
- Inadequate graphics engine
- Loss of programmers
- Failure in approval process of the game build after submission
If we assign impact and probability values to these risks, we obtain the following table.
| Risk | Probability | Impact |
| Graphics engine | 20% | 40 |
| Personnel | 33% | 50 |
| Certification | 8% | 100 |
The table itself suggests some observations.
- Experience, the mother of probability
Firstly, in a video game studio that launches, say, half a dozen titles a year, after 10 years of activity there is a portfolio of 60 titles that allows to draw certain conclusions about the frequency with which these risks occur. The probability estimate is based on the experience of the organization, which has suffered personnel losses in the programming area in one out of three projects.
- Simplify and then discuss the details
This model simplifies factors in just two values, but it is important not to lose sight of the fact that the variables hide more complex realities that should appear in the quantitative phases and in the discussions with the stakeholders. For example, loss of talent can hide many different realities, depending on the number of people lost, their roles within the organization, or whether the loss is due to a transfer to another company, vacation, retirement or inability to hire according to the forecasts of the HR department.
With all these nuances, when we load the table into ITM Platform’s online risk assessment matrix we obtain this result:
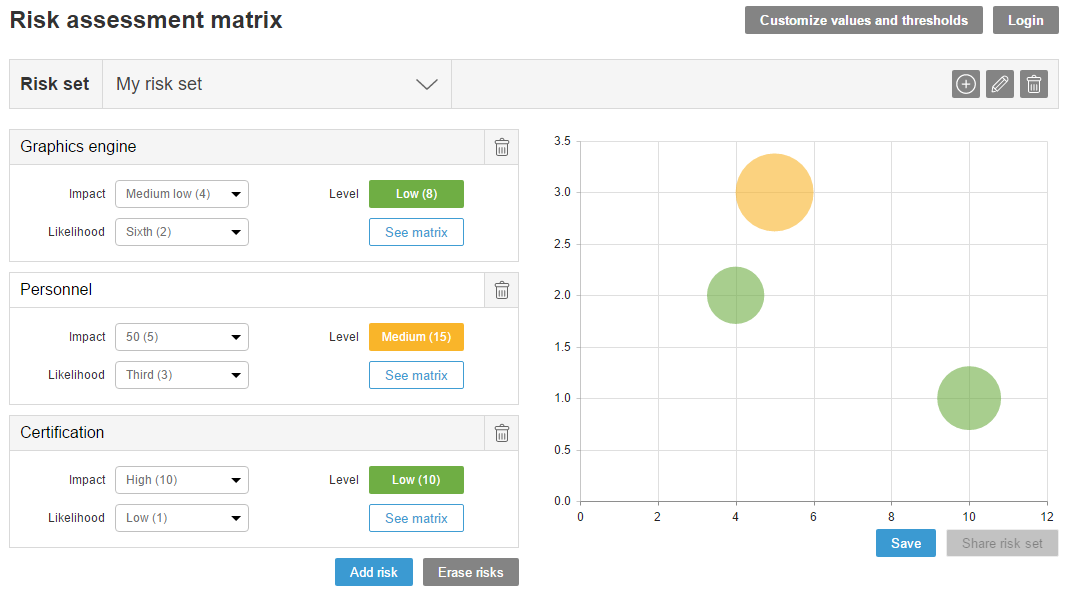
Although there is no single interpretation for this type of result, the visualization emphasizes that the most threatening risk for this study is the loss of personnel, while the selection of the graphics engine and certification seem to be more controlled by the workflow and process procedure. The HR department of the studio will probably need a mitigation plan in order to be able to face situations of personnel shortage in times of high load of work. Such a plan could include:
- Reassignment of tasks to existing resources.
- Segmenting possible delays, or cost increases in case the scope is maintained.
- Communication plan to stakeholders involved in the tasks who may suffer because of the delays.
- In severe cases, reconsideration of non-critical components that allow the viability of the product to be saved.
Remember that you can compose your own set of risks in ITM Platform’s online Risk Assessment Matrix. In addition, if you can register, save and share them with your team.
In the next article of this series, I will expand the example to the context of a quantitative evaluation to better understand the differences between the two approaches.
Try ITM Platform free for 14 days
Start managing your projects, resources, and portfolios today.