One of the most intangible tasks when managing risks is at the very beginning of the process. Not in designing procedures or planning, which is streamlined thanks to the efforts of the international community of experts in project management.
No. The most fleeting task is to define the risks and identifying threats before they are verified. For this purpose there is no definitive formula. But fear not, because the standard ISO IEC 31010: 2009 includes up to 30 techniques to identify risks which you can use for inspiration.
In this article we will discuss a selection of the twelve most interesting techniques. Note that the best results will depend on how you use a combination of different techniques to extract the maximum amount of valuable information. At the end of the day, it is the human talent in your organization who will be identifying, evaluating and planning all aspects related to the risks; techniques are only a shuttle to expedite the talks.
One of the techniques is the familiar SWOT analysis (Strengths, Weaknesses, Opportunities, and Threats). Although it is not a specific technique, the upside is that it is well known in any organizational environment, allowing rapid participation of people unfamiliar with the more technical aspects of risk management.
Brainstorming
It is not a specific method for identifying risks, but is commonly used in departments related to the creation and design of the product. However, it can also be applied to this area.
Allowing room for imagination, creativity and exchange of ideas can lead to discovering unidentified risks and thus taking appropriate measures before they happen.
Brainstorming can be done in different ways:
1. Structured brainstorming. Each participant works on their own and share only the ideas that seem most appropriate. A variant of this method is that each team member says his idea without having prior time to reflect on it. The main advantage of this method is that all team members have equal opportunities to contribute their ideas, regardless of their rank in the company or personality profile. The drawback may be the lack of spontaneity.
2. Free brainstorming. The meeting participants bring their ideas spontaneously. The advantage of this system is that participants can build their ideas spontaneously from the contributions of others and letting their imagination flow.
3. Silent brainstorming. In this case, post-it are used by each participant to write down their main ideas. Upon completion, post-its are placed on the board.
Checklists
Checkpoints ensure that no significant errors occur during the execution of the project.
Simplicity is their fundamental advantage. However, placing undue reliance on these lists can lead to avoiding an exhaustive analysis.
Lists are very useful for repetitive and highly standardized procedures such as manufacturing, but are deficient in innovative environments and in the context of customizable services.
SWIFT
The Structured "What-if" Technique essentially consists on an analysis method where you consider what the consequences of certain events could have for the project. The counselor of the session repeated again and again: "Should this happen, what could we do?"
SWIFT usually starts off with a brainstorming session to compile a number of risks, which are then structured in a logical sequence. Then they are analyzed in detail, taking into account their possible causes and consequences and allowing to identify interdependencies.
Situations analysis
Closely related to the method described above, however, this analysis uses different timelines or alternative contexts, which occur as the situations arise.
At the meeting, the impact that each of these scenarios would have on the project should be analysed, and the actions should be undertaken if appropriate.
Fault tree analysis
This is a useful tool to identify and analyze the causes that lead to an unwanted event. It is placed on the top of the diagram and then lines are drawn in the form of an inverted tree, identifying at successive levels the causes that led to it.
This technique could be considered as a particular type of brainstorming focused on causality. Possible causes that produce a certain event are discussed.
The emphasis of this technique in causality makes it particularly relevant when searching for solutions. Having identified the root cause of the problem, it’s easier to find ways to eradicate it and thus cancel undesired consequences.
Bow tie analysis
This analysis is characterized by an emphasis on the graphical representation of causes and consequences of a risk.
The risk is written in the center position of the diagram.
A causal tree, similar to the fault tree analysis, emerges to the left. To the right, a tree of direct and indirect consequences forms a mirror with the causes. The end result of the scheme resembles the shape of a bow tie, where the risk is the knot and the causes and consequences are each of the loops.
Direct observation
Although not a specific technique for risk identification direct observation has a prominent position. In fact, establishing a culture of lifelong care and continuing training is the best way to be prepared for any risk. The team assigned to a project is the first that can sense when something does not work in the appropriate way, making alarm ring and taking the necessary measures.
Incident Analysis
During the realization of a project, previously non identified risks are presented. Once submitted, you must perform an analysis of causality to know the reasons that have led to the occurrence and also examine the impact consequences have had on the whole project.
A register of these events and their analysis will form the basis for the detection of future risks.
Similarly, the repetition of a given risk should lead to an analysis of deeper causes on which we should act to achieve an effective solution.
Structured interviews and surveys
Structured interviews in which team members of different ranks and sections are selected allow you to obtain an overview of project status and potential risks that may arise. Despite the fact that questions are closed, face to face interaction allows to gather open feedback.
Surveys can be considered as a modified version of structured interviews, with the drawback of giving less room to open-ended questions.
However, they can result in larger samples and more representative data.
The Delphi method as an example of iterative system
The Delphi method is based on an expert consultation structured at successive levels that feed into each other, chasing progressively closer to an agreed response that can predict the future of a particular event or project.
In a second round, experts show their answers and these are elaborated in a group.
After several rounds, moderators modify the questions and seek common points that allow to reach a consensus, results are statistically analyzed and a collective response is achieved.
Applied to the identification of risks, the Delphi method is a robust and sophisticated system of consulting experts, as they are asked several times on the same subject thus getting closer and closer to a consensus among them.
Due to the repetitive nature of the consultations, the Delphi method is an iterative technique.
Monte Carlo analysis
The Monte Carlo analysis is a complex system of mathematical analysis whereby arithmetic calculations make approximations in which a precise solution cannot be obtained.
Specific software calculates the odds of different risks considered as random events, taking into account the impact each would have on the project and the likelihood of occurring. If you want to know more about this technique you can keep reading here.
Here are some recommended articles:
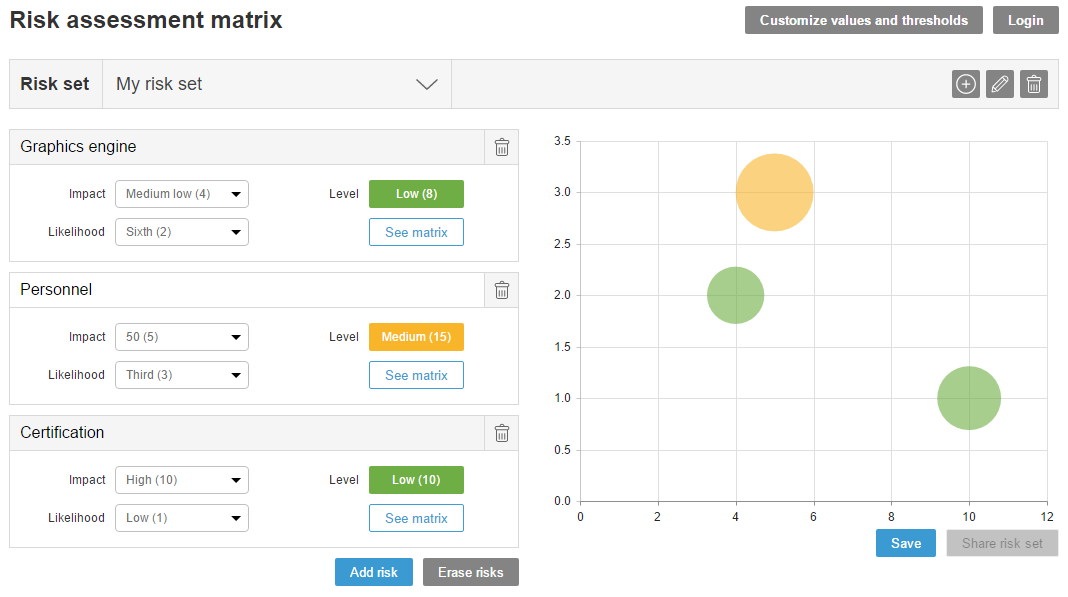
Our new Risk Assessment Matrix is online
Keys to becoming a good risk manager
Risk management… The what, the why and the what to do