Our guest author, Albert Garriga, the man behindrecursosenprojectmanagement.com, covers in detail two of the most powerful methodologies for multiproject situations: critical chain and earned value.
 A common situation in many companies is the existence of several projects running in parallel, which share and compete for the resources of the departments. This is what is known as a multiproject environment, and requires criteria and tools to prioritize the allocation of these resources and maximize the overall result of the organization.
In this article, we are going to discuss two methods to be able to manage multiproject organizations; which are based on two well-known project management methodologies: Critical Chain and Earned Value.
Start calculating the earned value of your ITM Platform projects
Critical Chain Prioritization
If projects are planned using the Critical Chain method, the protections of the different projects allow for an objective criterion for the decision making process, at least in relation to the schedule; as this shows the actual status of the project and the risk of not complying with the delivery date.
Imagine that we have six projects, each with its protection related to the tasks in its critical chain and its degree of progress. From this data, we can place them in a graph that shows the percentage completed on the horizontal axis and the percentage of protection consumption on the vertical axis.
The graph would be as follows and allows to distinguish three areas:
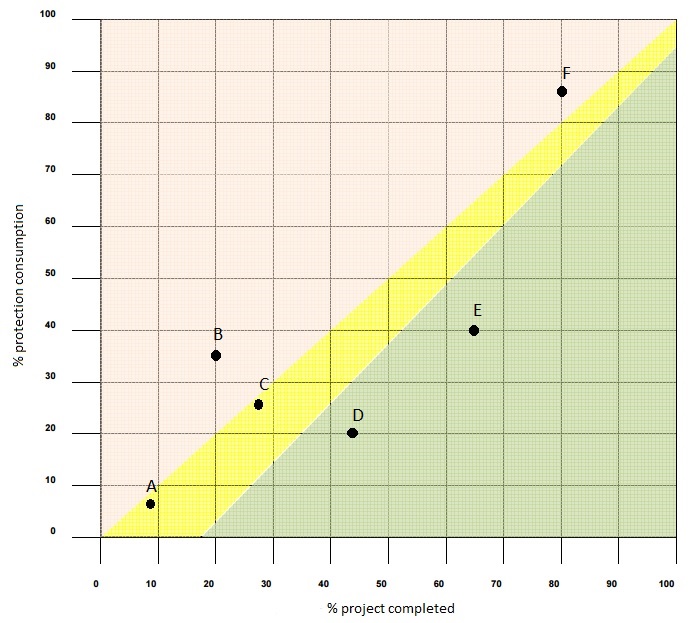
- Green area. The consumption of protection is low in relation to the progress of the task, implying that the project is performing better than expected, and therefore the confidence interval to meet the schedule has increased. This would be the case for projects D and E.
- Yellow area. The consumption of protection is close to the estimated, so we expect the project to meet the schedule. This would be the case for projects A and C.
- Pink area. These projects have consumed more protection than estimated for their degree of progress, so they will not meet the schedule if their performance does not improve or countermeasures are implemented. This would be the case for projects B and F.
This graph allows us to objectively compare the state of the different projects from the point of view of the schedule, and thus determine which of them need additional action to meet the objectives and which are less of a priority. Obviously, from the point of view of the organization, the objective is that all the projects fulfill their objective, which implies that all are in the green and yellow areas.
Based on this, it would be reasonable to pass resources from the green area projects to those in the pink area, and prioritize the latter in case of conflict. In a way, we are "damaging" the projects that are better to "favor" those which are worse, with the aim of all going as expected.
Another important point when it comes to prioritizing projects according to this chart is to view their progress, since a more advanced project will cost more to change their situation than one that is just starting:
- In the pink area, means that a more advanced project will have higher priority when it comes to receiving resources than one that is less advanced.
- In the green area, the opposite is true: the more advanced projects are the least priority, since the reduction of resources will have a lower impact on the final result (less time to act).

Prioritization with Earned Value
In projects managed with Earned Value, it is also possible to objectively prioritize and compare their status’, with the advantage being that in this case we can make time and cost comparisons simultaneously through different parameters:
Cost variation (CV), which is calculated as a percentage CV = (EV-AC) / EV, where EV is the earned value and AC is the actual cost, which is used with the following criteria:
- CV> 0: project is saving money
- CV = 0: the project is following the planned cost line
- CV <0: the project presents extra costs.
Schedule variation (SV), which is calculated as SV = (EV - PV) / PV, where EV is the earned value and PV is the planned value, and is used with the following criteria:
- SV> 0: the project is ahead of schedule.
- SV = 0: the project is on schedule.
- SV <0: the project is behind schedule.
Imagine that we have six projects managed with Earned Value, which allows them to be shown together in a chart according to their SV and CV; distinguishing four areas:
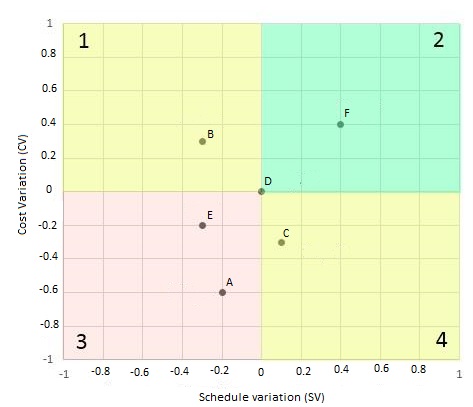
- The pink area (3) shows the projects that are not meeting either the costs or deadlines (projects A and E); which then become the highest priority.
- The two yellow areas (1 and 4) show the projects that are not meeting one of either cost (project C) or schedule (project B).
- The green area (2) means that the project is better than planned in relation to cost and time (project F), or is progressing just as planned in point 0.0 (project D)
According to this criterion, the goal of the organization would be to have all projects in the green area. Therefore, the criterion in prioritizing resources would be as follows:
- Prioritize the use of the most economical resources for projects in areas 3 and 4, which can be done even if it implies a delay in the projects of area 4, since these have more time in terms of schedule.
- Increase resources for projects in areas 1 and 3 so that they can be completed quicker, even at the expense of higher costs in area 1 projects, taking advantage of having savings on them.
- This prioritization can be done "at the expense" of the projects in area 2, since these have the margin to delay or assume higher costs. Except the projects in 0,0 which would be better left alone, as they are perfectly on track.
The most complex situation occurs in the projects located in area 3, since these must improve simultaneously both cost and time. This implies that we must avoid improving one variable by lessening the other.
Final considerations on prioritization
So far, the prioritization between projects has been treated objectively and based on quantifiable variables, which is correct but insufficient. In reality, there is another aspect to take into account: the political or commercial interests of the organization.
If we think beyond the time or cost of executing the projects, we see that not all of them are just as important for the organization. In some cases, we will have projects that can generate new orders or have high visibility, which gives them priority. Therefore, the person in charge of managing the portfolio of projects must know these political and commercial aspects, and know how to balance them with the objective criteria.