What is a Schedule?
Ask five people on the same project when a deliverable is due and you may get five different answers. That is exactly the problem a project schedule is designed to solve: a single, shared view of what happens and when. Without one, deadlines drift, dependencies are missed, and status meetings turn into guesswork.
A schedule is a list of the tasks and processes that make up a project, each with a planned start and end date. It focuses strictly on the time dimension of the plan. Scope, cost, resources, and quality are managed in their own artifacts, even though every change to those areas eventually shows up in the schedule.
Why the schedule is more than a list of dates
A well built schedule does three things at once:
- It sequences work according to dependencies, so the team always knows what unblocks what.
- It exposes the critical path, which is the chain of tasks that determines the project’s overall duration.
- It becomes the reference document for tracking progress and reporting to stakeholders.
Treat the schedule as a living artifact, not a one off Gantt printed at kickoff. The moment it stops being updated, it stops being useful.
The main types of project schedules
There is no single “right” way to draw a schedule. The format you choose depends on the audience, the complexity of the work, and what you need to communicate. The four representations below cover the vast majority of real world cases.
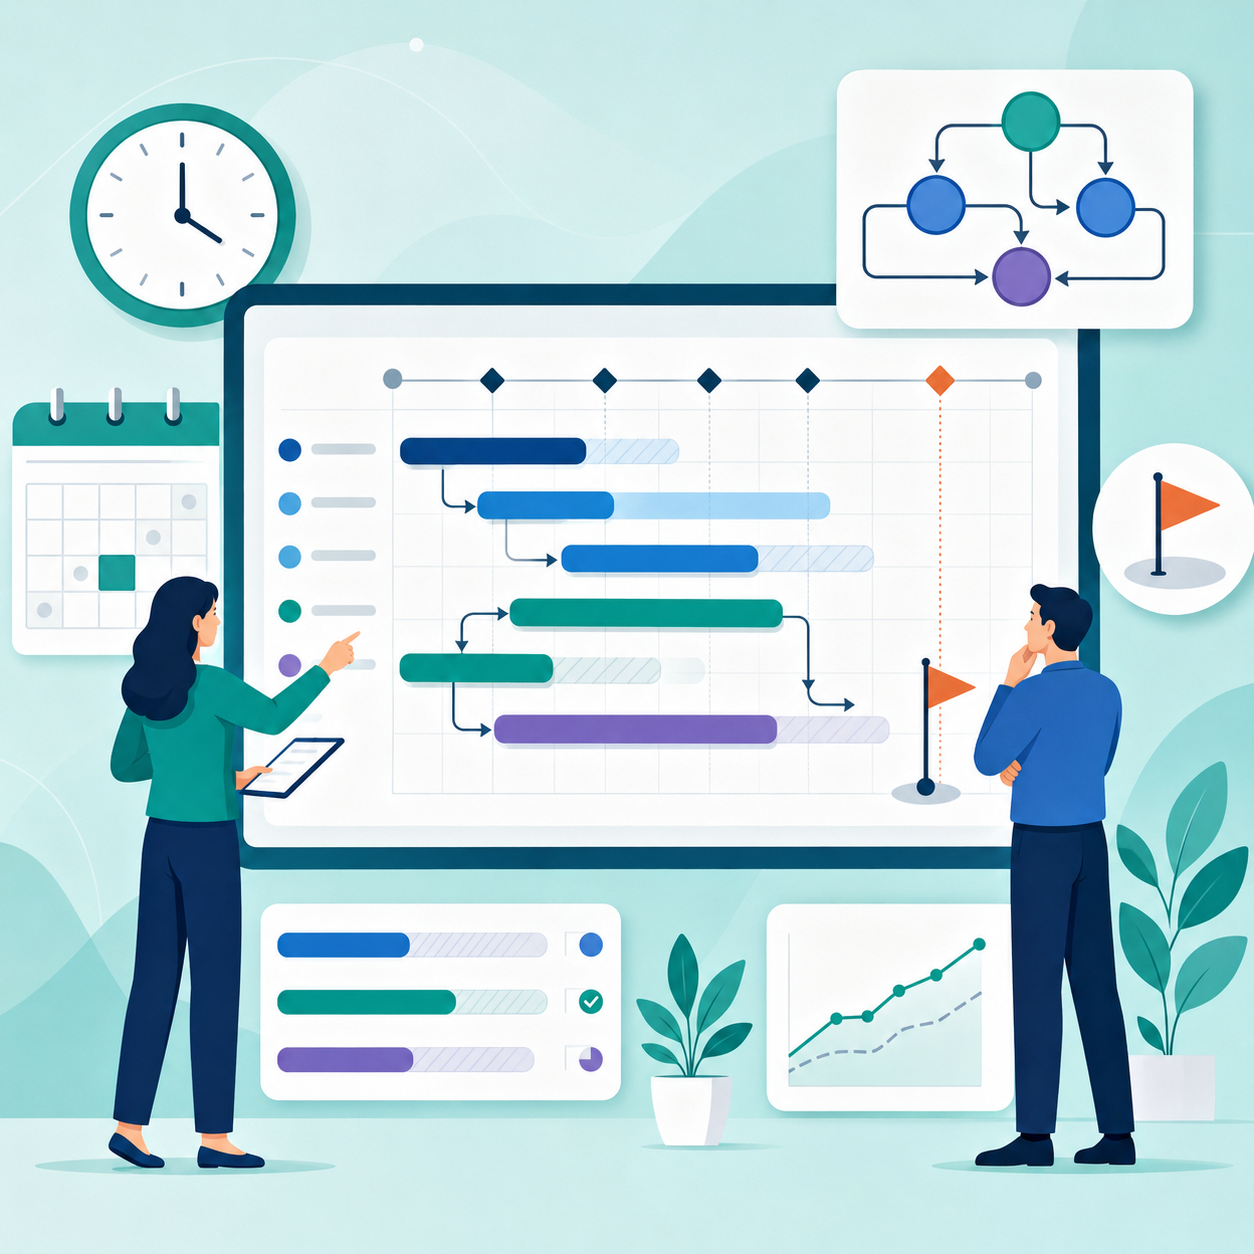
Gantt chart
The Gantt chart is the most widely used graphical representation of a schedule. Tasks appear as horizontal bars along a timeline, with their length proportional to duration and their position showing start and end dates. Dependencies between tasks are drawn as arrows.
Its strengths are obvious:
- Start dates, end dates, durations, and overlaps are visible at a glance.
- Almost every project team is already familiar with the format, so the learning curve is short.
- Modern PPM tools layer additional intelligence on top: critical path highlighting, automatic rescheduling when a predecessor slips, and respect for non working days defined in the project calendar. You can see how the Gantt chart with critical path and automatic scheduling is configured in ITM Platform as an example of this approach.
For more on sequencing tasks well, see our guide on how to estimate the duration of a task.
PERT chart
A PERT chart (Program Evaluation and Review Technique) does not use a timeline. It focuses on tasks and the relationships between them, which makes it especially useful when dependencies are more important than absolute dates.
Each task is shown as a box, and arrows between boxes capture causality and dependency: a task that receives an arrow depends on the task at the other end. Boxes are arranged left to right in the order they should be completed.
A PERT chart answers the question “what must happen before this can start?” before it answers “when does this start?”
This makes PERT a good complement to a Gantt chart on complex projects with many interdependent activities.
Milestone schedule
A milestone is an important event in the life of a project: a key delivery date, a steering committee decision, a regulatory approval, a phase gate. Not every task is a milestone; in fact, very few are.
A milestone schedule strips out the noise and shows only those key dates. It can be derived from a Gantt chart by hiding the regular tasks, or built independently for executive communication. Inside ITM Platform, a regular task can be converted into a milestone directly on the Gantt, and summary tasks are used to roll up groups of related work into a single bar.
Baseline and updated schedule
Once the project schedule is approved by the steering committee, it becomes the baseline: the official benchmark against which actual progress is measured. As work is executed, an updated schedule is drawn on top of the baseline, usually in a different color, so the team can compare what was planned with what really happened.
| Schedule view | Purpose | When you use it |
|---|---|---|
| Baseline | Frozen reference at approval | Variance analysis, status reports |
| Updated | Reflects real progress | Daily tracking, replanning |
| Forecast | Projected completion based on current trend | Early warning of slippage |
A clear baseline makes it obvious whether a task is ahead, on track, or late, and by how much. Baselines in ITM Platform capture schedule, effort, cost, and revenue at the moment of approval, so the planned versus real comparison can be done across all of them at once, not only on dates.
Building a schedule that survives contact with reality
A schedule on paper is easy. A schedule that survives the first month of execution is harder. A few practical habits help:
- Plan in dependencies, not in dates. Let the tool calculate the dates from the network of tasks. When something slips, downstream work moves automatically.
- Use the project calendar. Holidays, weekends, and team specific working hours should be modeled once and respected everywhere.
- Set a baseline early. Without a baseline, you have nothing to measure against, and “delay” becomes a matter of opinion.
- Update on a regular cadence. Weekly updates are usually enough. Daily is overkill, monthly is too slow.
- Communicate with the right view. Executives want milestones; team leads want the Gantt; auditors want the baseline comparison.
For a broader perspective on managing the time dimension of a project, our overview of project time management goes deeper into the planning, sequencing, and control processes that surround the schedule itself.
Next steps
The format matters less than the discipline behind it. A Gantt chart, a PERT chart, or a milestone view will all work, as long as the schedule is kept current, anchored to a baseline, and shared with the people who need it.
- Request a demo of ITM Platform and see Gantt, baselines, and milestones working together in a real PPM environment.
- Explore planning and monitoring features to see how Gantt, baselines, and milestones fit together end to end.
Try ITM Platform free for 14 days
Start managing your projects, resources, and portfolios today.