
Everything you should include in a project status report
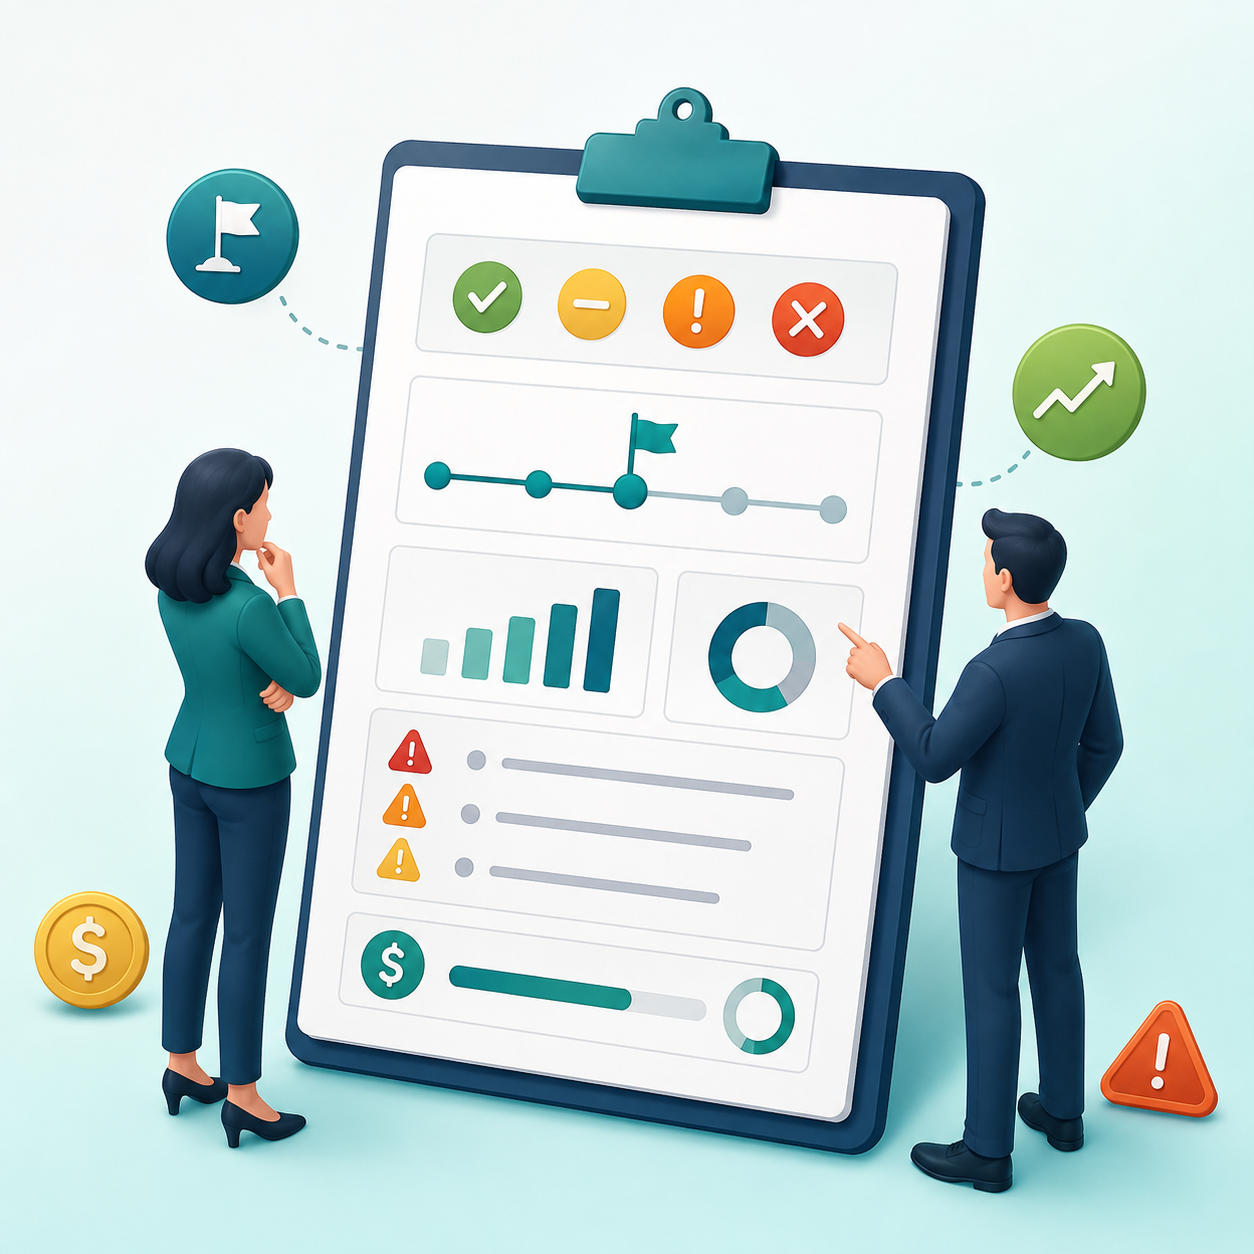
Your sponsor opens your latest status report, scans it for thirty seconds, and asks the one thing it does not answer: is this project still going to land on time? If that question feels familiar, the problem is rarely the project. It is the report. A status update that buries the signal in a wall of activity leaves the reader guessing, and guessing is exactly what a report exists to prevent.
A project status report is a structured snapshot of progress: a clear, accurate, and objective account of where the work stands against the plan, and of what that means for the deadline, the budget, and the scope.
Get that structure right and the report almost writes itself, cycle after cycle. Below is everything a good one should include, and why each piece earns its place.
Why a repeatable format beats a one-off update
The single most valuable property of a status report is that it can be compared. A report only becomes a decision-making tool when the reader can hold it against something else:
- Across phases of the same project, so you can see how far the work has actually moved and whether the projections you made earlier held up.
- Across similar projects, so discrepancies between estimates and real data stand out instead of hiding inside each project’s own narrative.
If your organization has no reporting model, every author invents their own, and nothing lines up. A shared template fixes that, and it does something else too: because readers already know where each piece of information lives, they find what they need in seconds. This is one of the areas where a Project Management Office pays for itself, by setting the standard and enforcing it across teams.
| One-off update | Standardized status report | |
|---|---|---|
| Comparable over time | No | Yes |
| Reader knows where to look | No | Yes |
| Reveals estimate vs actual drift | Rarely | By design |
| Effort per cycle | High, from scratch | Low, fill the template |
The executive summary: the heart of the report
This is the section every reader opens first, and often the only one a busy sponsor reads at all. It needs an objective description of how the project is running, presented simply, and it should cover:
- Milestones reached
- Key deliverables and their quality
- Risks and unforeseen events that have appeared
- The relationship between estimates and reality across resources, cost, and deadlines
- The gap between planned progress and progress to date
That last point deserves attention. When the estimated percentage complete and the real percentage complete start to diverge, you have your earliest warning that a deadline is slipping, long before the date itself is missed. If you want to turn that gap into a proper indicator, our guide to the difference between estimated and actual percentages shows how to read it and act on it.
Writing this narrative from a blank page, every reporting cycle, is the most time-consuming part of the job. ITM Platform can draft the executive summary straight from your live project data, so you edit a first version instead of starting from nothing. It is worth seeing how AI-generated reports pull that summary together.
Progress assessment: flag the problems early
Where the executive summary states where things stand, this section explains what to do about it. A constant evaluation of the project is what tells you which countermeasures to take, so use it to outline the most problematic areas honestly.
It is also the place to record corrections that are already in motion. Projects rarely have the luxury of waiting for feedback before acting, so decisions get made, and a good report documents them rather than pretending the plan is untouched.
A control register for risks and issues
A status report should say something useful about the risks on the table, and the cleanest way to do that is to work from a register instead of writing prose from memory. A basic register captures:
- The risk factors in play
- Their probability
- Their impact on the project
In practice this register is your risk and issue log: each entry scored by probability and impact, paired with a mitigation or contingency plan, and given a clear path to escalate a risk into an issue the moment it materializes. ITM Platform keeps that log alongside the work it affects, so the report reflects the live picture. The mechanics are covered in risk and issue management.
The metrics that keep a report objective
Managing a project is only possible when you can quantify it, and quantified data is what turns a report from opinion into evidence. Depending on the project, the metrics worth tracking include:
- Delivery times against the schedule
- Quality of deliverables, measured against the requirements they were meant to meet
- Cost incurred to date
- That cost as a percentage of the total budget
- Unplanned costs that have appeared
- Hours worked, by person or by professional category
A metric only drives tracking when it is visible. Rather than copying figures into a document by hand each week, you can surface them live on customizable dashboards that feed the report in real time, so the numbers in your summary are the numbers your team is actually working with.
Result indicators when the output is a service
When the deliverable is a service rather than a physical product, a set of result indicators opens up: number of users, average cost per user, adoption, and so on. These measure the quality of what you delivered, not just whether you delivered on time, and they connect a single project’s report to the value it contributes across the wider portfolio.
Keep it tight, keep it comparable, and lead with the answer your reader is looking for. Done consistently, the status report stops being a chore and becomes the fastest way to keep every stakeholder aligned.
Next steps
- Start a free ITM Platform trial and build your first status report on live project data.
- Grab the free risk assessment matrix to populate the risk section of your report in minutes.
- Keep reading: Strategic alignment: selecting the most valuable project portfolio for your business.
Try ITM Platform free for 14 days
Start managing your projects, resources, and portfolios today.