20 AI Prompts Every Project and Portfolio Manager Should Be Asking
20 practical AI prompts organized by scope - ten for project managers, ten for PMO directors - with reasoning and guidance on what to do with each answer.
20 practical AI prompts organized by scope - ten for project managers, ten for PMO directors - with reasoning and guidance on what to do with each answer.
Selecting the right PPM tool for your organization is a significant step towards aligning your project portfolio to the business strategy, and it doesn't come without challenges and risks. This article lays out a path to make objective and solid decisions to choose the software solution that matches your company's actual needs.
Lean Portfolio Management (LPM) improves the way organizations make decisions about project and product development. In this post, we thoroughly analyze its components, its benefits, and how to evaluate whether LPM is for your organization.
Use the retirement of MS Project Online as a chance to move to ITM Platform, unifying planning, capacity and financials into AI-enhanced strategic portfolio management.
Create a practical project management methodology, enhanced with AI through PMPilot, to turn your internal rules into real-time answers inside ITM Platform.
Every project follows a life cycle, but not every project should follow the same one. Learn how predictive, iterative, and adaptive approaches work, when each one fits, and why modern portfolios mix them.

Hourly billing offers flexibility and transparency in project management, aligning client expectations, driving profitability, and fostering trust.
AI promises big changes for project and portfolio managers. Some are already here. Let's explore what's available and what's to come.

Effective communication is the linchpin of successful project management, bridging strategy, adaptability, and stakeholder alignment
Data visualization promotes alignment and clarity in project portfolio management, both internally and for clients.
Engaging Team Members in the PPM process leads to improved work execution, cost control, and progress reporting.
OKRs (Objectives and Key Results) are a management tool to align strategy, activities, and outcomes. Improve your project portfolio using OKRs.
When you install a PMO or any other form of project portfolio management structure, your number one task is to connect with the rest of the company, its processes, and people.
This guide lays out the key questions to fully understand revenue recognition, the difference between cash flow and revenue, the five golden rules that set the standard for revenue recognition, and analyzes the primary methods for calculating revenue recognition.
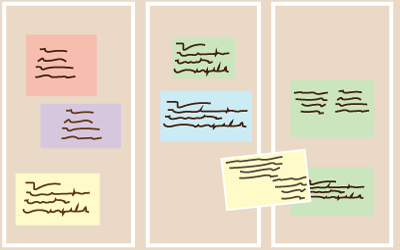
If your company uses agile project management, you'll find tracking progress differs significantly from the waterfall predictive model. Here we unpack the mysteries of Burndown Charts and Cumulative Flow Diagrams