Choosing which projects to invest in is a strategic decision to be taken based on objective data. In this article, we explore the problem of subjectivity and analyze the solution that allows management to make decisions based on a business plan, in a rigorous and transparent way.


The Problem

In businesses where the source of income comes from making projects for clients, it is easy to decide which ones are to be put in place: (usually) those of greater profitability. And in some cases, all, if sufficient resources are available.

However, internal projects, such as those of transformation, tend to not offer such an obvious criterion as their value to the business is less evident and often more subjective to anticipate.

The fact that an expected value is subjective does not mean that its effects are not going to be real. It means that the benefits are hard to predict, and investment decisions can be based on perceptions.

This is a challenge that managing directors have always tried to address. The most used resource as a solution has been that of the "business case", which requires promoters to express the profitability or value contribution of their initiative in measurable terms, either in sales increase or in cost reduction.

The main difficulty presented by the business case is the human factor: a promoter of an initiative that has a strong motivation to give positive figures and show that their idea is profitable. Though it is desirable to have intrapreneurs on your team it is essential to validate their figures through a homogenous and and objective process.

The second difficulty of requesting profitability to internal projects arises from each promoter having limited vision to their area of competence, defending their plot without considering the overall vision. In turn, management considers these business cases as if they had been generated with the same criteria, which is not usually the case. Each promoter applies with different degree of ingenuity the data to the same template.

The issue at hand is knowing when to recognize, in an objective fashion, what initiatives will bring more value to the business when the projects deliver their expected benefits.


The Approach

When it comes to value, it is not always possible to apply a purely financial standard via project profitability based on forecasts in isolation and in comparison of each other.

  • The value contribution of a project to a strategic plan may be broader than profitability, even if the savings or earnings have been realistically calculated. For example, a process automation project can throw modest savings, but positively influence a priority target of customer quality perception.
  • Strategic project planning should not consider initiatives in isolation, as the result of the set may be greater than the sum of the parties. It is common for the result of some projects to enable others, and its set to offer strategic value. This is why program and portfolio management exceeds project management.

The strategic management of projects lies in the competence of the management and must be facilitated by the Project Management Office (PMO) to the extent that their objectives are the maximization of value and not only the transversal coordination.

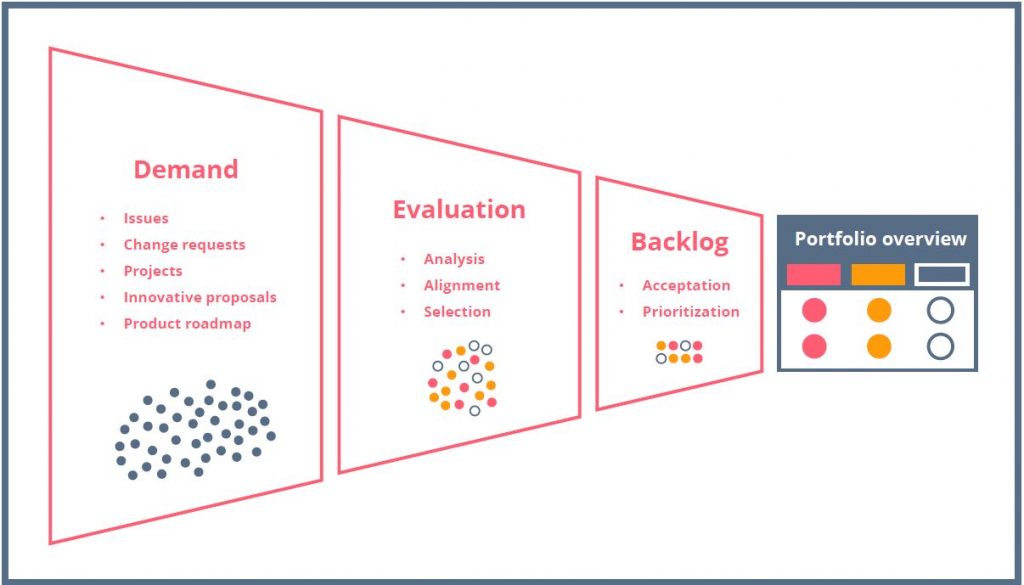
Thus, the strategic planning approach to the composition of the project portfolio should consider two main elements:

  1. A strategic plan that exposes the objectives of the Organization
  2. A list of project proposals (initiatives)

With these two elements, we can prioritize initiatives that will order them from higher to lower value, generating an orderly list of approved projects (portfolio backlog).

Strategic management of project portfolios

A great advantage that offers prioritization of projects by value is that it supports applying resource constraints as a cut-line to its output. If we have a list ordered by value and – for example-a budgetary limitation, we will be able to establish the approval of projects based on those that contribute more value and that are within the available budget.


The Process

Once we have the two main elements (objectives and demand), we can start two classification processes that can run in parallel or go in sequence. What is important is to isolate each other to ensure objectivity and ease of adaptation to the general standard.

Process 1: Prioritization of Objectives

Participants: Board of Directors
Objective: To put some objectives in front of others, with specific weight of each one on the total.

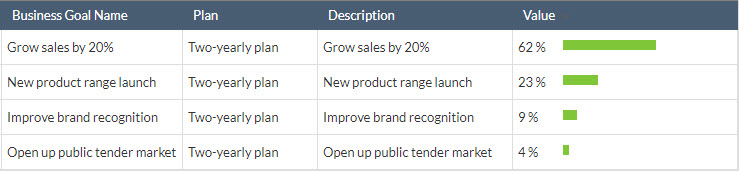
Sometimes strategic plans already specify priorities, but in others they do not give explicit weight by objective. For example, how much more important is "to grow in sales by 20%" than "to increase operating efficiency by 15%"?

There are several techniques that can be employed to achieve a table like the one above. From something as simple as an agreement amongst the Board of Directors to the most sophisticated such as an Analytic Hierarchy Process (AHP). The latter could be considered more rigourous, though its execution could be simple if you have a Pairwise Comparison Tool, like the one provided by ITM Platform.

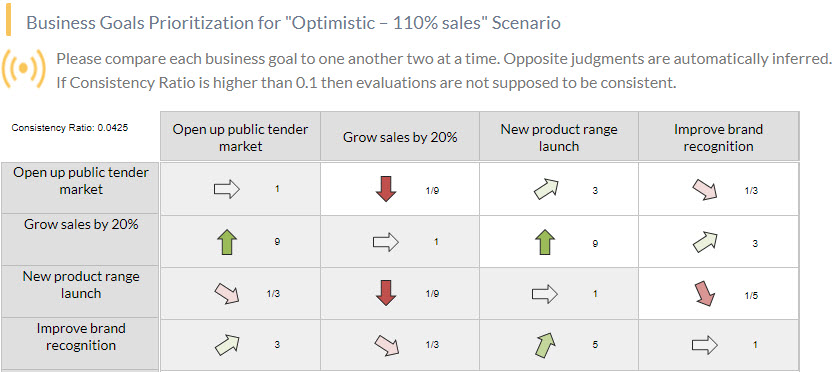
This simple table will generate an orderly and quantified list of objectives.

As an added feature, ITM Platform calculates a "consistency ratio" that indicates how logical and objective the prioritization is. In this article, you will find an explanation of how this index is calculated.

It is possible to make different sets of the same objectives through scenarios, and even use different objectives for different programs. The reality is complex and there is not always a single combination or scenario.

Process 2: Contribution of project value to objectives

Participants: The Project committee and promoters

Objective: To determine how much each project contributes to each objective


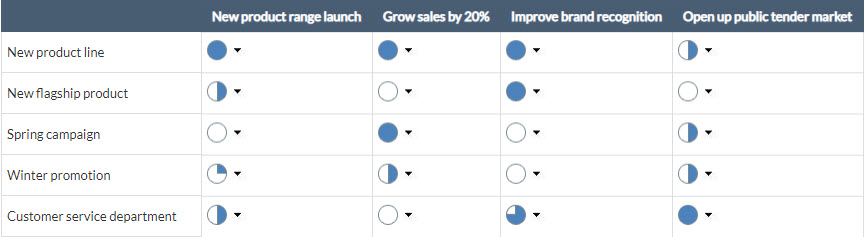
Ignoring for now the relevance of each objective on the strategic plan, this step will assign a weight to the contribution of each initiative to each objective. This weight will be translated to a number base on 100, but if you use ITM Platform you can also use the comparison by pairs previously used or use a qualitative methodology based on ideograms such as the image (Harvey balls), providing a visual support.

Process 3: Analysis of the optimal selection of the Portfolio

The two previous phases provide the necessary parameters for the system to calculate the value of each project, based on 100 and depending on the value of each objective.

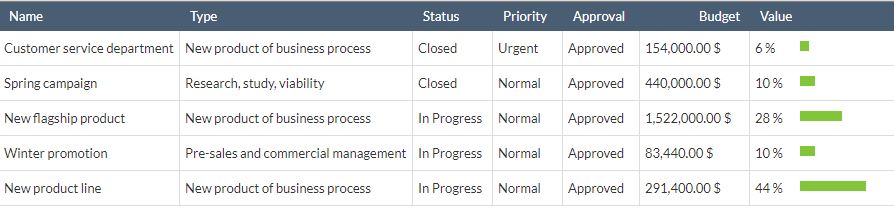
List of initiatives orders by value

If money wasn't a problem, then we would probably carry out all “reasonable" projects. But in a real organization, the resources available are finite and the previous list of initiatives is not enough to make a good selection of project portfolios.

Thus, it is not only enough to select the most valuable projects, but it is also necessary to filter those that fall within the constraints, be it economic, technical and human resources, or temporary.

In this article, we will use the available budget as an example of a main constraint because this is the most frequent case. Imagine that we should select a portfolio of projects that does not exceed $900.000. Taking the previous list into account, the "New Star Product" ($ 1.5 M) exceeds that amount and also provides a similar value to other more economical projects.

So, with the data we have, we choose the combination of projects that are closer to the available budget: a total of $885.400 and a value of 61% accumulated in three projects.

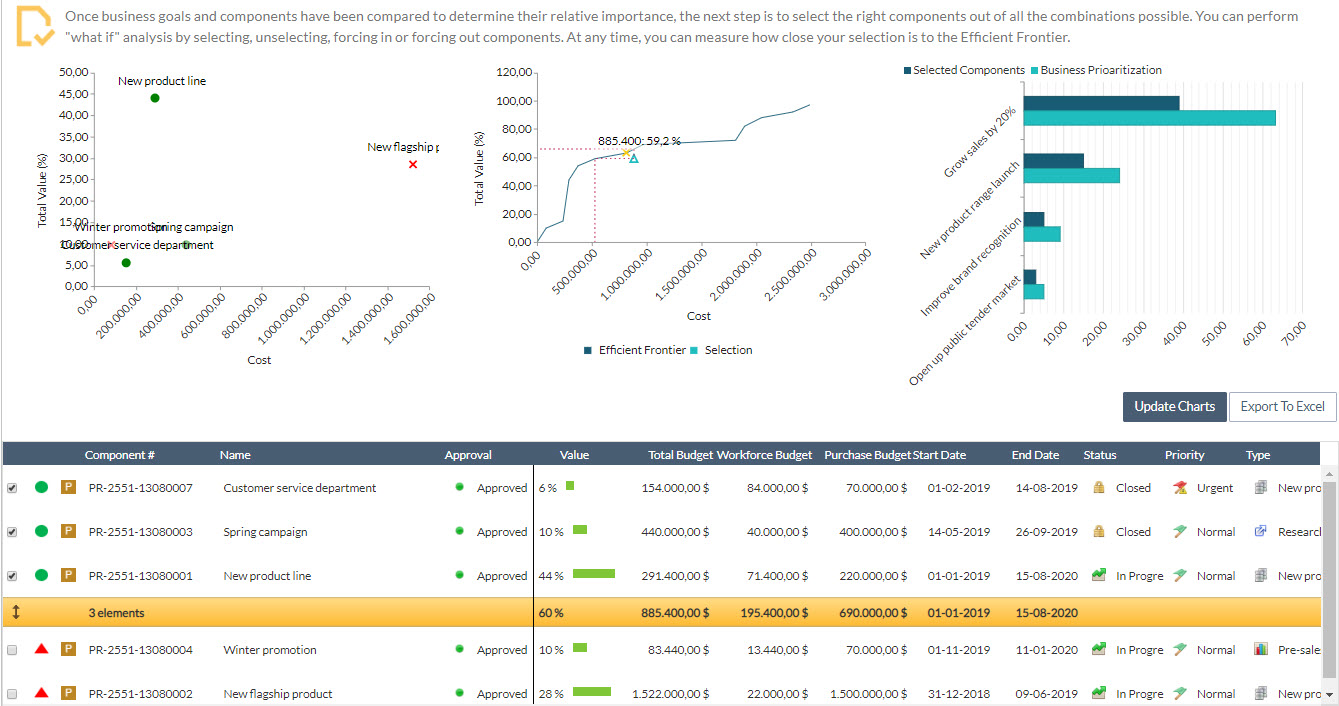
With this selection achieve the given criteria. But note that the efficient central border graph is indicating the selection is not optimal (value/cost) and that there are better combinations: similar value for less money or greater value for the same sum.

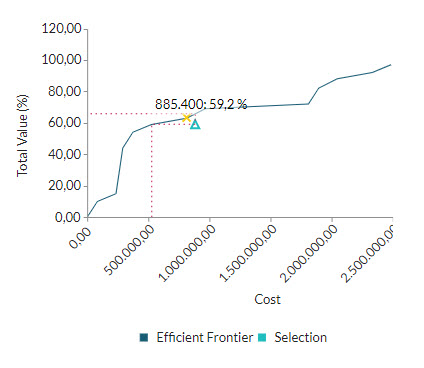
And, indeed, with a portfolio of a total of $528.840 we achieved a contribution of value very similar for 35% less in cost.

If you are interested in understanding how the calculation scheme is made,

Download the guide here.

Conclusion

It is possible to apply rigorous standards in the selection of a portfolio of projects, basing the selection on the value they bring to the business strategy.
Key points to consider:

  • A separation of work between the management team that defines and prioritizes objectives, and the teams that analyze the benefits by project.
  • A process sponsored by management requiring rigorous standards when making investment decisions and implementing transparency between teams.
  • An integrative platform that combines information and exposes the results.

If you want to know more about the management of organizations by projects, download the white paper, where you will learn to:
- Connect management of your Organization with that of projects
- Manage portfolio of projects to create competitive advantage
- Agile Portfolio Management


Receive the latest blogs directly into your inbox


Qualitative and quantitative risk analysis are two very different processes. In this article we explain qualitative evaluation with an example taken from the video game industry.

In general, qualitative analysis seeks to identify risks by using scales that summarize visually and intuitively the relative dimensions of each risk, allowing to prioritize: providing a visual representation that combines the most basic factors, such as the impact that the risk would have on a project and the likelihood of it occurring.

In spite of its name, qualitative evaluation implies a numerical estimate of these two variables along previously defined scales using a quick and subjective approach. It's something like when doctors ask: From one to ten, how much does it hurt?wong-baker faces pain rating scale

Similarly to the intuitive scale of Wong-Baker's expressions, qualitative assessments of risk have visual translations in a geometric representation that allows a systematic comparison in risk assessment matrices.

In the example that follows, we have used our online risk assessment matrix to estimate the comparative weight of the following risks for a team of developers in a video game studio:

  • Inadequate graphics engine

  • Loss of programmers

  • Failure in approval process of the game build after submission

If we assign impact and probability values to these risks, we obtain the following table.

Risk

Probability

Impact

Graphics engine

20% 40

Personnel

33% 50

Certification

8% 100

The table itself suggests some observations.

  1. Experience, the mother of probability

Firstly, in a video game studio that launches, say, half a dozen titles a year, after 10 years of activity there is a portfolio of 60 titles that allows to draw certain conclusions about the frequency with which these risks occur. The probability estimate is based on the experience of the organization, which has suffered personnel losses in the programming area in one out of three projects.

  1. Simplify and then discuss the details

This model simplifies factors in just two values, but it is important not to lose sight of the fact that the variables hide more complex realities that should appear in the quantitative phases and in the discussions with the stakeholders. For example, loss of talent can hide many different realities, depending on the number of people lost, their roles within the organization, or whether the loss is due to a transfer to another company, vacation, retirement or inability to hire according to the forecasts of the HR department.

With all these nuances, when we load the table into ITM Platform’s online risk assessment matrix we obtain this result:

Risk matrix videogame sector example

Although there is no single interpretation for this type of result, the visualization emphasizes that the most threatening risk for this study is the loss of personnel, while the selection of the graphics engine and certification seem to be more controlled by the workflow and process procedure. The HR department of the studio will probably need a mitigation plan in order to be able to face situations of personnel shortage in times of high load of work. Such a plan could include:

  • Reassignment of tasks to existing resources.

  • Segmenting possible delays, or cost increases in case the scope is maintained.

  • Communication plan to stakeholders involved in the tasks who may suffer because of the delays.

  • In severe cases, reconsideration of non-critical components that allow the viability of the product to be saved.

Remember that you can compose your own set of risks in ITM Platform’s online Risk Assessment Matrix. In addition, if you can register, save and share them with your team.

In the next article of this series, I will expand the example to the context of a quantitative evaluation to better understand the differences between the two approaches.


Receive the latest blogs directly into your inbox


business management meeting and brainstorming concept with people on the round table in top view

One of the most intangible tasks when managing risks is at the very beginning of the process. Not in designing procedures or planning, which is streamlined thanks to the efforts of the international community of experts in project management.

No. The most fleeting task is to define the risks and identifying threats before they are verified. For this purpose there is no definitive formula. But fear not, because the standard ISO IEC 31010: 2009 includes up to 30 techniques to identify risks which you can use for inspiration.


In this article we will discuss a selection of the twelve most interesting techniques. Note that the best results will depend on how you use a combination of different techniques to extract the maximum amount of valuable information. At the end of the day, it is the human talent in your organization who will be identifying, evaluating and planning all aspects related to the risks; techniques are only a shuttle to expedite the talks.

One of the techniques is the familiar SWOT analysis (Strengths, Weaknesses, Opportunities, and Threats). Although it is not a specific technique, the upside is that it is well known in any organizational environment, allowing rapid participation of people unfamiliar with the more technical aspects of risk management.

Brainstorming

It is not a specific method for identifying risks, but is commonly used in departments related to the creation and design of the product. However, it can also be applied to this area.

Allowing room for imagination, creativity and exchange of ideas can lead to discovering unidentified risks and thus taking appropriate measures before they happen.

Brainstorming can be done in different ways:

1. Structured brainstorming. Each participant works on their own and share only the ideas that seem most appropriate. A variant of this method is that each team member says his idea without having prior time to reflect on it. The main advantage of this method is that all team members have equal opportunities to contribute their ideas, regardless of their rank in the company or personality profile. The drawback may be the lack of spontaneity.

2. Free brainstorming. The meeting participants bring their ideas spontaneously. The advantage of this system is that participants can build their ideas spontaneously from the contributions of others and letting their imagination flow.

3. Silent brainstorming. In this case, post-it are used by each participant to write down their main ideas. Upon completion, post-its are placed on the board.

Checklists

Checkpoints ensure that no significant errors occur during the execution of the project.

Simplicity is their fundamental advantage. However, placing undue reliance on these lists can lead to avoiding an exhaustive analysis.

Lists are very useful for repetitive and highly standardized procedures such as manufacturing, but are deficient in innovative environments and in the context of customizable services.

SWIFT

The Structured "What-if" Technique essentially consists on an analysis method where you consider what the consequences of certain events could have for the project. The counselor of the session repeated again and again: "Should this happen, what could we do?"

SWIFT usually starts off with a brainstorming session to compile a number of risks, which are then structured in a logical sequence. Then they are analyzed in detail, taking into account their possible causes and consequences and allowing to identify interdependencies.

Situations analysis

Closely related to the method described above, however, this analysis uses different timelines or alternative contexts, which occur as the situations arise.

At the meeting, the impact that each of these scenarios would have on the project should be analysed, and the actions should be undertaken if appropriate.

Fault tree analysis

This is a useful tool to identify and analyze the causes that lead to an unwanted event. It is placed on the top of the diagram and then lines are drawn in the form of an inverted tree, identifying at successive levels the causes that led to it.

This technique could be considered as a particular type of brainstorming focused on causality. Possible causes that produce a certain event are discussed.

The emphasis of this technique in causality makes it particularly relevant when searching for solutions. Having identified the root cause of the problem, it’s easier to find ways to eradicate it and thus cancel undesired consequences.

Bow tie analysis

This analysis is characterized by an emphasis on the graphical representation of causes and consequences of a risk.

The risk is written in the center position of the diagram.

A causal tree, similar to the fault tree analysis, emerges to the left. To the right, a tree of direct and indirect consequences forms a mirror with the causes. The end result of the scheme resembles the shape of a bow tie, where the risk is the knot and the causes and consequences are each of the loops.

Direct observation

Although not a specific technique for risk identification direct observation has a prominent position. In fact, establishing a culture of lifelong care and continuing training is the best way to be prepared for any risk. The team assigned to a project is the first that can sense when something does not work in the appropriate way, making alarm ring and taking the necessary measures.

Incident Analysis

During the realization of a project, previously non identified risks are presented. Once submitted, you must perform an analysis of causality to know the reasons that have led to the occurrence and also examine the impact consequences have had on the whole project.

A register of these events and their analysis will form the basis for the detection of future risks.

Similarly, the repetition of a given risk should lead to an analysis of deeper causes on which we should act to achieve an effective solution.

Structured interviews and surveys

Structured interviews in which team members of different ranks and sections are selected allow you to obtain an overview of project status and potential risks that may arise. Despite the fact that questions are closed, face to face interaction allows to gather open feedback.

Surveys can be considered as a modified version of structured interviews, with the drawback of giving less room to open-ended questions.

However, they can result in larger samples and more representative data.

The Delphi method as an example of iterative system

The Delphi method is based on an expert consultation structured at successive levels that feed into each other, chasing progressively closer to an agreed response that can predict the future of a particular event or project.

In a second round, experts show their answers and these are elaborated in a group.

After several rounds, moderators modify the questions and seek common points that allow to reach a consensus, results are statistically analyzed and a collective response is achieved.

Applied to the identification of risks, the Delphi method is a robust and sophisticated system of consulting experts, as they are asked several times on the same subject thus getting closer and closer to a consensus among them.

Due to the repetitive nature of the consultations, the Delphi method is an iterative technique.

Monte Carlo analysis

The Monte Carlo analysis is a complex system of mathematical analysis whereby arithmetic calculations make approximations in which a precise solution cannot be obtained.

Specific software calculates the odds of different risks considered as random events, taking into account the impact each would have on the project and the likelihood of occurring. If you want to know more about this technique you can keep reading here.


Here are some recommended articles:

Our new Risk Assessment Matrix is online

Keys to becoming a good risk manager

Risk management… The what, the why and the what to do


Receive the latest blogs directly into your inbox


conveyor robot manipulators work businessman in front of control panel analysis production development Risk management has a specific place in protocols and risk management models. In this article we will discuss the six steps to controlling risk for risk managers, as broken down in the PMBOK: planning, identification, qualitative analysis, quantitative analysis, response planning and monitoring.

In short, a risk manager should take the reins of the risk control process with a detailed plan; find out what the risks are that may affect team members and various units of the organization, assess risks from the perspective of the whole organization; create action plans to respond to each of the risks if they occur; and continuously monitor in order to improve the plan.

Risk management planning

Like any other aspect of project management, risk prevention and response in the case of risk occurrence should be subject to strict planning. Risk management is iterative, implying that the planning phase will be reviewed after each cycle.

More specifically, planning involves a series of essential decisions that will affect the following five steps. Choosing methodologies, assigning responsibilities, defining types and categories and risks, as well as allocating resources are some of the main areas of focus at this moment.

Risk identification

This step is to identify the risks that may affect the development of the project and understand their characteristics. It is essential to identify all risks that may potentially influence the project so that the necessary precautions can be taken and disaster can be avoided. Therefore, planning for all risks is essential. Do not ignore them but instead control them.

For the identification of risks, multiple systems can be used.

One of them is to use similar backgrounds, both in our company and in other companies that resemble by their activity or reach.

Another possibility is to use specific analyzing tools (Ishikawa diagram, flowchart or other types of specialized diagram systems) or other standardized analysis systems, such as SWOT analysis (Strengths, Weaknesses, Opportunities, Threats).

Finally, if the first two possibilities are not feasible, you can resort to expert judgment.

After identification, it is important to proceed to classify risks that have been detected (Technical, external, organizational, management, etc.). Their influence on the project (mild, moderate or severe impact on the project), or the probability of the risk arising (low, intermediate or high probability).

Qualitative analysis

This analysis is used initially to filter risks and prioritize them in order of importance and severity. Although this analysis may not be the best in terms of accuracy and speed.

This type of analysis is also used for risks which need immediate attention. The urgency leads to an analysis that, despite not being the best in absolute terms, is most appropriate for the time available.

The results of this analysis should reflect in a risk assessment matrix.

Quantitative analysis

This is a more comprehensive systems analysis, but also the most complex and time consuming.

To perform a quantitative analysis, specific quantitative risk analysis systems should be used, such as mathematical simulations e.g. Monte Carlo.

A simpler option is to use a decision tree with which you can numerically illustrate the parameters derived for each choice.

If it is not possible to quantify the risks, you can turn to experts in the field to conduct an assessment.

Ideally, experts should be external to the project in order to prevent conflicts of interest. In addition, to avoid bias, the evaluation should be conducted blindly without knowing the outcome of assessments made by the other experts.

There are differences between this point and the assessment of experts in qualitative analysis. While in the former case, experts estimate the relative importance between different types of risks in order to focus on the most important, in the quantitative case experts, despite not having actual data, provide estimates as accurate as possible based on their experience and the results of other projects that they have led previously.

Risk response planning

When a threat is verified, the response must be preplanned and follow the correct procedure. Action plans must be drawn up when risk in the project is present in order to prevent its occurrence. This may include transferring it to an external agent or mitigating their effects, in the event that the risk occurs. Where risks cannot be avoided, in the event of circumstances beyond our control or scope, contingency plans should be developed that allow for coordinated and appropriate action.

Risk monitoring

To predict whether or not risks may occur it is necessary to know warning signs so that it can be anticipated. If this is not possible, monitoring mechanisms should be in place so that a risk in a project can be detected the moment it presents itself.

The purpose of these systems is to instil the attitudes of anticipating risks and having contingency plans in place, before the risk has significantly influenced the project.

In addition, self-monitoring the reaction to the risks and the occurrence of them can improve prevention measures, and thus reduce time and increase the efficiency of the reaction.


Here are some recommended articles:

Our new Risk Assessment Matrix is online

Keys to becoming a good risk manager

Risk management… The what, the why and the what to do


Juan Delgado

Blogger ITM Platform

Receive the latest blogs directly into your inbox


A guy looking in a binocular, standing on a pile of books, clouds, stars, apple, TrophyIf you want to become a risk manager, you will have to combine two types of training.

On the one hand, you must be a specialist in a particular field. For example, if you want to be a risk manager in the field of medicine or pharmaceuticals, you’ll need medical training, or hospital management training.

On the other hand, you need to acquire specialist training in risk management. Several institutions offer specific degrees in these areas.

Where to find risk management training

These are some of the major international institutions offering specific training in risk management.

Institute of Risk Management. Founded in 1986 in the UK with the aim of facilitating training and certification in risk management, it has international prestige and is one of the first institutions to grant degrees in this area. The diplomas offered are: the International Certificate in Enterprise Risk Management, the International Diploma in Enterprise Risk Management and Certificate in Risk Management in Financial Services. The price is around £1,000 for non-members.

Project Management Institute. The international reference for project management also has a specific course on risk management: the PMI Risk Management Professional (PMI-RMP). The certificate costs $670 (or $520 if a member of a PMI institute), and is obtained after a multiple choice test based on the PMI-RMP manual, which is available for free in this pdf.

The Chartered Insurance Institute. Also based in the UK, it is a comprised of approximately 120,000 members in societies in over 150 countries. It is the world's largest professional association in the field of financial planning and insurance. Although not dedicated solely to risk management, it provides accreditation in this and other areas.

If you’re hot for the more academic part of the issue, a host of Higher Education Institutions in the US offer Risk Management courses, from Stanford’s strategic decision and risk management courses to the PhD programs offered by Columbia University’s (Decision, risk and operations) or the University of Pennsylvania’s insurance and risk management. As you can imagine, this is the kind of PhD program that can be at least as rewarding careerwise as the most expensive MBA.

Of course, big firms and multinational corporations also have their say. If you’re interested in in-company training tailored to the needs of your organization and in implementing international standards like ISO 31000:2009, you can look up BSI’s risk management training courses or ASQs’ risk management essentials and implementation strategies.

Risk Doctor. Under the slogan "Exploiting Uncertainty Future", this website is the initiative of David Hillson, a celebrity in the field who calls himself the "Risk Doctor". It specializes in training for risk managers. Their slogan makes reference to precisely one of the functions of risk and project management: to turn adversity into strengths. On the page you can find plenty of resources, from books and scholarly articles to specialized webinars and videos of Hillsons’ conferences.

Constant Change

Even with good training and certification, risk management, like any other discipline, is subject to constant change and evolution. A professional who wants to stay up to date must constantly be looking for new sources of training and information. To do this, the internet is your best ally.

We recommend periodically visiting our blog where you can find up to date risk management and project items.


Here are some recommended articles:

Our new Risk Assessment Matrix is online

Keys to becoming a good risk manager

Risk management... The what, the why and the what to do


Receive the latest blogs directly into your inbox


Risk matrix

What is a risk assessment matrix?

The matrix presents a set of risks on a graph where the x-axis represents the impact of risk and the y-axis represents the probability. For example, the impact of a fire occurring at the warehouse  of a distribution company will be in the maximum values ––it’s a real catastrophe for business! However, since a good prevention plan makes this event highly unlikely, the resulting display places the risk  in the upper left quadrant. Conversely, the same organization may also consider more probable risks of minor impact, such delays in delivery or even the loss of materials.

When viewing risks from these two parameters, the matrix allows to better compare and prioritize them. Results are often counter-intuitive. For example, one might think that a fire is the biggest risk, with loss of delivery items ranking second and delays at a solid third position. However, the fire prevention plan in the warehouse  means the risk is very unlikely, while the volume of deliveries can fluctuate from “almost never” to one-digit percent points.

Obviously, if you never missed a delivery, your first mistake doesn’t count much. But when it happens every day, your reputation is at stake.

For managers of this imaginary company, it is essential to understand what is delaying drivers or preventing successful deliveries. Because deliveries can happen every day in the hundreds or thousands, a five percent delay rate can bring the company to the brink:

Risk assessment matrix example risks

How does our matrix work?

We have set the matrix to display three default risks that you can probably apply to any project: loss of personnel, scope changes and company acquisition. You can then adjust values of probability and impact in these fields, or erase them all and start from scratch.

For each new risk follow these three steps:

  1. Click on the button "Add risk"
  2. Give it a name that describes it
  3. Assign impact and probability values

Each time you create a risk, it appears in the chart (the risk label will show if you hover over it), and once you have defined several different risks you will see that the circle size varies depending on the level of risk exposure.

Customize, save and share your risk sets

The colors depend on the assigned risk thresholds by default, but you have the option to edit risk thresholds and impact and probability values by clicking the button "customize values and thresholds".

Since we want the tool to be useful, you can also register via the "login" button to store all your risk sets, saving them for future reference.

Don’t forget to share the tool if you liked it! And if you want the risk matrix to be systematically linked to your current projects, we recommend you try ITM Platform for free. You will have access to the most comprehensive project, programs and portfolio management tool on the market.

Receive the latest blogs directly into your inbox